

O'Shaughnessy trending value investment strategy
By Tim du Toit — 39 years of quantitative investing experience. Author of Quantitative Value Investing in Europe: What Works for Achieving Alpha. Last updated: April 2026.
Trending Value strategy — definition:
A two-factor quantitative investment strategy developed by James O'Shaughnessy that selects the 10% most undervalued stocks by Value Composite Two score, then buys the 25–50 with the highest six-month price momentum. Back-tested over 45 years (1964–2009), it returned 21.19% per year versus 11.22% for the market.
Key findings at a glance
- 21.19% average annual return over 45 years (1964–2009) for the 25-stock portfolio
- Beats the market by ~10% per year — All Stocks universe returned 11.22% annually over the same period
- Lower volatility than pure momentum — Sharpe ratio and maximum drawdown both better than single-factor strategies
- $1,000 → $6.9 million after 45 years with 25-stock portfolio (vs $4.1 million with 50 stocks)
- Maximum drawdown: 50.5% — strategy is not without risk; discipline in downturns is essential
The James O’Shaughnessy Trending Value investment strategy is based on two basic principles:
- Pick the most undervalued companies
- With the highest stock price increase over the past six months
To implement the strategy you simply:
- Select the 10% most undervalued stocks ranked by the Value Composite Two indicator (also developed by James O’Shaughnessy) and then
- Buy the top 25 or 50 stocks with biggest price increase over the past six month.
The strategy was developed and explained by James O’Shaughnessy in the fourth edition of his excellent book What Works on Wall Street: The Classic Guide to the Best-Performing Investment Strategies of All Time.
It REALLY works as it beat the market by 10% each year in the 45-year back test period between 1964 and 2009.
Trending Value background information
Before I show you exactly how to implement the trending value investment strategy first a bit of background information.
Part 1 - What is the Value Composite Two Indicator?
Value Composite Two is a valuation indicator that is calculated using the following six valuation ratios:
- Price to book value
- Price to sales
- Earnings before interest, taxes, depreciation and amortization to Enterprise value (EBITDA / EV)
- Price to cash flow
- Price to earnings
- Shareholder Yield (Dividend yield + Percentage of Shares Repurchased)
The reason it works so well is because Value Composite Two is a single indicator that lets you find undervalued companies based on different valuation metrics, for example cash flow, book value, sales, EBITDA and cash returned to shareholders.
To calculate it you simply rank each company against all other companies using on all of the valuation ratios. Once you have ranked all the companies you add up all the individual rankings into one combined ranking for each company and rank all the companies by this combined ranking and then group them in percentiles (from 1 to 100). 1 is the most undervalued companies and 100 the most expensive.
For example if a company has a price to sales ratio that is in the lowest one percent for all the companies in the database, it gets a price to sales rank of 1 (lower is more undervalued) and if a company has a PE ratio in the highest one percent (it is overvalued) of all the companies in the database it will get a PE rank of 100.
All calculations done for you
Don’t worry if this looks intimidating, in the Quant Investing stock screener we do all the calculations for you. This means you can find all the companies that fit this investment strategy with a few mouse clicks.
Screen for Trending Value stocks in minutes
The Quant Investing screener calculates Value Composite Two for over 22,000 companies worldwide and lets you filter by the cheapest 10% with a single slider. Sort by Price Index 6m to rank by momentum — the full Trending Value screen takes less than two minutes to set up.
Try the Trending Value screen free for 30 days
No credit card needed. Cancels automatically after 30 days.
Part 2 - What is momentum?
The second part of the trending value strategy is to buy companies with the biggest six month stock price increase, this is also called momentum.
A momentum strategy simply means buying stocks with the highest past price increase over a certain time period.
Lots of independent researchers have found that stocks that have had high returns over the past three to twelve months continue to perform well. You can find out more about momentum and why it works so well in this article: 10 myths about momentum investing, squashed
The downside of the momentum strategy it can be very volatile.
For example, James found out that investing in 10 percent of the stocks with the highest 6-month price appreciation returned a maximum of 175.2 % in one year but it also had the highest drawdown of -62.4%.
Part 3 - Combining momentum and value
In his book, James O’Shaughnessy found that by combining momentum and value factors you can significantly increase your stock market returns. He named the combined momentum and value investment strategy the Trending Value portfolio.
This is how the Trending Value portfolio is implemented:
- Include only stocks with a market capitalization over $200 million
- Select the 10% most undervalued companies using the Value Composite Two indicator
- Select the 25 or 50 stocks with the best six-month price appreciation – Use Price Index 6m in the stock screener
Trending Value vs pure value vs pure momentum
Over the 45-year back test, Value Composite Two alone returned 17.30% annually and six-month momentum alone returned 14.52% annually. The combined Trending Value portfolio returned 21.19% — higher than either factor alone. This outperformance comes from the combination effect: value identifies underpriced companies, while momentum filters for those the market is already beginning to re-rate.
O'Shaughnessy found that companies selected on multiple valuation ratios outperform single-ratio strategies 82% of the time, and adding momentum to that composite reduces the "value trap" problem.
Does the trending value strategy work?
Before implementing the strategy in your portfolio I am sure you want to know it works. James tested the strategy extensively and it worked very well. But before I show you the performance numbers first a bit of background information.
What data was used in the back test?
To test the strategy James used data from Standard & Poor’s Compustat Active and Research Database and the Center for Research in Security Price (CRSP) over the 45 year period from 1964 to 2009.
12 monthly portfolios re-balanced once a year
He formed a portfolios each month that were held for one year and then calculated the average returns of all 12 portfolios. This was done as having only one portfolio that was re-balanced once a year in the same month may over- or understate the performance of the strategy due to a very large profit or loss in a few companies or because of seasonal effects depending on what month the portfolio was formed.
What companies were included?
The investment universe included companies with a market capitalization of over $200 million (adjusted for inflation). All stocks were equally-weighted and included U.S. companies and foreign stocks in the form of American Depository Receipts.
This is how it performed
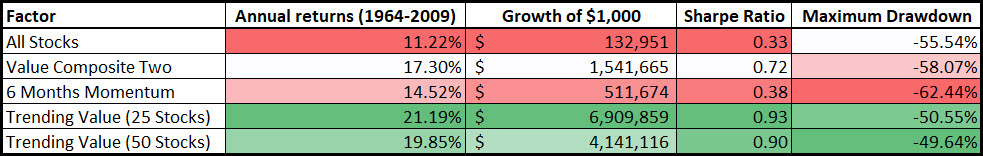
Click to enlarge
Source: James O’Shaughnessy: What Works on Wall Street: The Classic Guide to the Best-Performing Investment Strategies of All Time
Market performance
In the 45-year period between 1964 and 2009 the All Stocks universe earned an average annual compound return of 11.22% - the market index in other words.
Performance of the single ratios
If you bought the most undervalued stocks using only the Value Composite Two indicator you would have earned 17.30% annually.
If you used a momentum strategy over the same period by only buying the stocks with the best six-month price appreciation you would earned an average of 14.52% per year.
As you can see both strategies outperformed the All stocks universe (market index). The maximum peak to trough decline of the market was 55.5%.
Performance of combining value and momentum
But if you combined the two factors into Trending Value portfolio strategy and bought the best ranked 25 stocks you would have achieved an average yearly return of 21.19% over 45 years. The maximum peak to trough decline was 50.6%.
As you can see the Trending Value portfolio significantly outperformed the other two single factor strategies and the All Stocks universe. The portfolio also experienced lower volatility (higher Sharpe ratio) and lower maximum declines.
Trending Value portfolio consisting of 50 stocks earned a yearly average return of 19.85% with a slightly lower maximum drawdown. The maximum peak to trough decline was 49.6%.
Another back test confirmed it’s a great strategy
We have not back tested the Trending Value investment strategy but a friend of ours did for his master’s degree thesis. I wrote an article about it here: The best investment strategy in Europe from 2000 to 2014 – data driven
The strategy was not exactly the same as trending value but it was close and he came to the same conclusion that combining value and momentum is a great idea.
How to implement the Trending Value strategy in your portfolio
Now for the step by step instructions on how you can implement this strategy in your portfolio with our stock screener.
It is very easy to do, here are the steps:
- Select the companies with market capitalization above $200 million by entering 200,000 in the box below Market value (000)
- As the Primary Factor choose Value Composite Two in the box below Primary Factor and use the sliders to select the 10% of the most undervalued companies – set the slider from 0% to 10%
- In the box below Countries select the countries where you would like to invest
- Click on the Apply button to run your screen
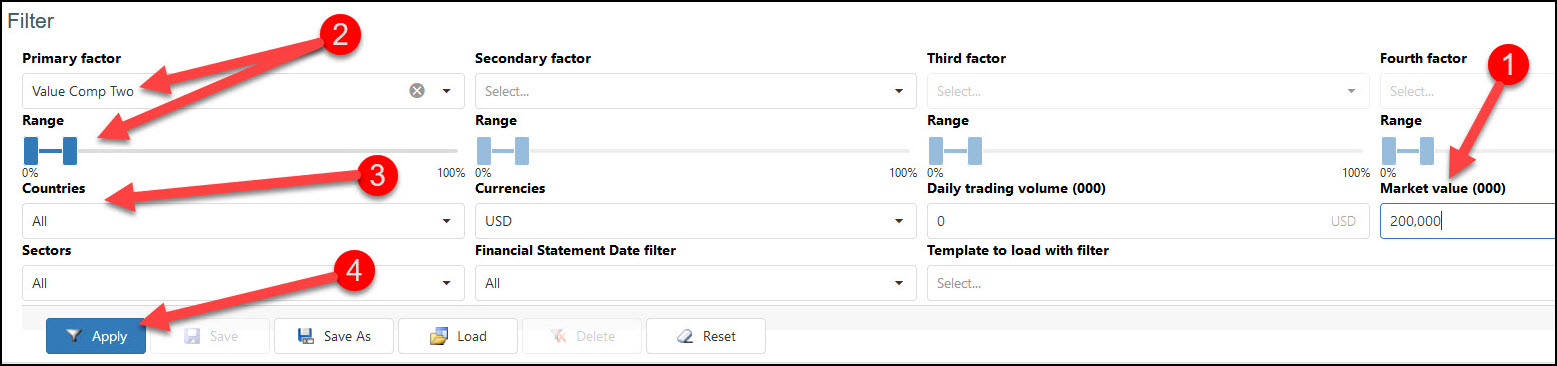
Click to enlarge
In the results table from the screener click on the Price Index 6m column heading twice to sort the companies by six months price momentum from high to low. High is good momentum and low is bad momentum.
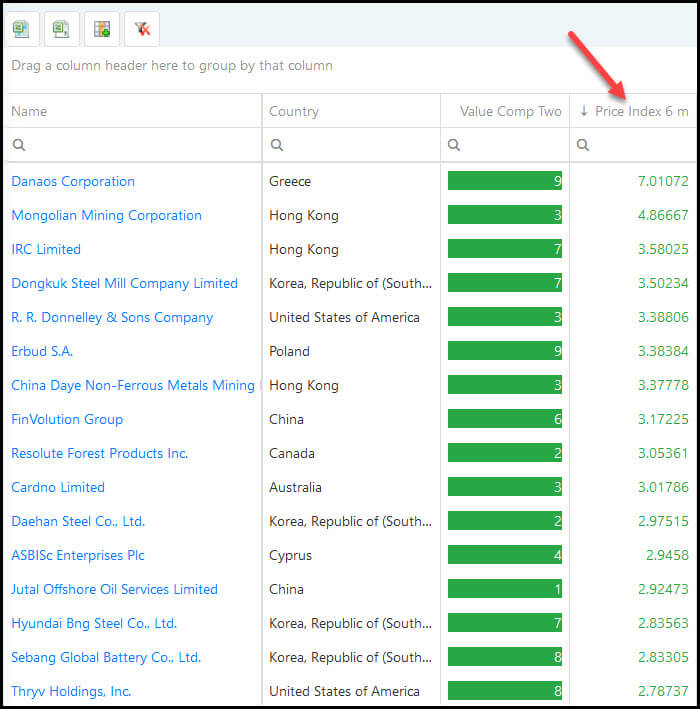
Click to enlarge
Buy the best 25 or 50 ideas
After you have selected all the above-mentioned criteria, the top 25 or 50 companies fit the Trending Value portfolio.
As you saw in the above table if you include more than 25 companies in your portfolio it will reduce volatility and drawdowns, while making returns a bit lower.
Investing a total of $1,000 in the top 25 stocks of the Trending Value portfolio would net you $6.9 million after 45 years. During this period, you would experience a volatility of 17.44% and a maximum drop in the value of your portfolio of 50.55%.
If you bought 50 Trending Value stocks each year it would have lowered your volatility to 16.51% and given you a slightly lower maximum drop in value of 49.64%. On other hand, you would have given up a large portion of returns. After 45 years you would end up with $4.1 million dollars or 40% less than 25 stocks portfolio.
Summary and conclusion
As you have seen the Trending Value strategy is a simple strategy that looks for undervalued companies with an upward moving stock price. And it works VERY well as it returned an average of 21.2% per year over a period of 45 years.
Using strategies that have historically produced market besting results is the key to long-term investing success. And combining undervalued stocks with good share price momentum is a great way to get market beating returns.
But remember even this investment strategy, like all investment strategies is not without risk. The maximum fall of in the value of the portfolio was 50.5%. In the end you will only be rewarded with your ability to stick to the strategy in good and bad – this is the really hard part.
Start running the Trending Value strategy in your own portfolio
You now have everything you need to implement this strategy: the Value Composite Two screen, the 6-month momentum sort, and the 25 or 50 stock selection rules. The free demo screener includes full access to all of this — with real back-test data going back to 2015 — so you can verify the strategy yourself before committing.
Test Trending Value with the free demo screener
No credit card needed. Cancels automatically after 30 days.
Frequently asked questions
1. What is the Trending Value investment strategy?
Trending Value is a quantitative strategy developed by James O'Shaughnessy that combines deep value screening with price momentum. You first identify the cheapest 10% of stocks by Value Composite Two score, then select the 25 or 50 with the strongest six-month price increase. The strategy returned 21.19% annually over 45 years in O'Shaughnessy's back test from 1964 to 2009.
2. How many stocks should I hold in a Trending Value portfolio?
O'Shaughnessy tested both 25- and 50-stock versions. The 25-stock portfolio returned 21.19% annually but had a maximum drawdown of 50.55%. The 50-stock portfolio reduced volatility slightly (drawdown 49.64%) but returned 19.85% annually — giving up roughly 40% of terminal wealth over the full period. If you can tolerate the higher volatility, 25 stocks produces significantly better long-term returns.
3. What is the Value Composite Two indicator?
Value Composite Two is a composite valuation ranking developed by O'Shaughnessy that scores companies on six ratios simultaneously: price to book, price to sales, EBITDA to enterprise value, price to cash flow, price to earnings, and shareholder yield (dividends plus buybacks). Each company is ranked on all six ratios, the ranks are summed, and companies are grouped into percentiles from 1 (cheapest) to 100 (most expensive). Using six ratios together outperforms any single ratio 82% of the time.
4. How often should I rebalance a Trending Value portfolio?
O'Shaughnessy's back test used annual rebalancing. He formed 12 monthly portfolios each held for one year to avoid results being distorted by a single month's seasonal effect, then averaged the results. Annual rebalancing is the standard implementation.
5. Does Trending Value work outside the United States?
O'Shaughnessy's original test covered U.S. companies and ADRs. An independent European back test (master's thesis) covering 2000–2014 found that combining value and momentum produced similarly strong results in European markets, consistent with O'Shaughnessy's conclusions. The Quant Investing screener applies Trending Value to over 22,000 companies across worldwide markets.