

Magic Formula Investing and Momentum investment strategy
By Tim du Toit — 39+ years of quantitative investing experience. Author of Quantitative Value Investing in Europe: What Works for Achieving Alpha. Last updated: April 2026.
This article shows you the back tested returns of the Magic Formula investment strategy in Europe over the 12 year period from June 1999 to June 2011.
You can also see how you can improve the Magic Formula returns from 183% to 783% by just adding one simple easy to calculate ratio.
First a bit of background information.
You most likely already know the Magic Formula investment strategy was developed by Joel Greenblatt and described in his excellent book called The Little Book that Still Beats the Market. It is also the book that got me started with quantitative investing.
Magic Formula + Momentum strategy — definition:
A two-factor stock selection strategy that first ranks companies by Joel Greenblatt's Magic Formula (earnings yield + ROIC), selects the top 20%, then re-ranks those by 6-month price momentum (Price Index 6m). Back tested in Europe from June 1999 to June 2011: 783.3% return vs 30.5% for the market.
Key Findings:
- Magic Formula alone returned 183% over 12 years in Europe (1999–2011) vs 30.5% for the market
- Adding 6-month price momentum increased the return to 783% — a 600% improvement
- 12-month momentum was the second-best addition: +472% improvement
- 2016–2023 update: strategy CAGR +9.6% vs benchmark +7.4%
- Back tested across 17 Eurozone countries, ~1,500 companies, excluding banks, REITs and investment funds
What the Magic Formula does
The Magic Formula finds good quality companies that are trading at an attractive price. It does this by looking for companies with a high earnings yield (companies that are undervalued) and a high return on invested capital (ROIC) (quality companies).
The formula then ranks the universe of companies on ROIC (where 1 is the company with the highest ROIC), and by earnings yield (where 1 is the company with the highest earnings yield), and then sum the two ranks to give a combined score.
The Quant Investing stock screener does all this for you with the click of a mouse.
Companies with the lowest combined rank (high quality companies that are undervalued) are recommended, usually the top 30 companies.
This is how the two Magic Formula investing ratios are calculated:
Return on invested capital (ROIC) = EBIT / (net working capital + net fixed assets).
Earnings yield = EBIT / Enterprise value.
Before I show you the returns of the Magic Formula first some information on how we tested.
The back test universe and benchmark
Our back test universe was a subset of companies in the Datastream database containing an average of about 1500 companies in the 17 country Eurozone markets during our 12-year period from 13 June 1999 to 13 June 2011.
The universe excluded banks, insurance companies, investment funds, certain holdings companies, and REITS.
Bankrupt companies were included to avoid any survivor bias. For bankrupt companies, or companies that were taken over, returns were calculated using the last stock market price available before the company was delisted.
Companies with an average 30-day trading volume of less than €10,000 were excluded.
It was not a good time to invest in stocks
Even thought the test period was short it was not a good time to be invested in stocks. The 12-year period included a stock market bubble (1999), two recessions (2001, 2008-2009) and two bear markets (2001-2003, 2007-2009).
Holding periods and quintile tests
Each year all the portfolios were formed on 16 June. We chose 16 June as most European companies have a December year-end and by this date all their previous year-end results would be available.
The annual returns were calculated as the 12-month price change plus dividends received. Returns were compounded on an annual basis. This means each year the return of the portfolio (dividends included) would be reinvested (equally weighted) in the strategy the following year.
The portfolios were all constructed on an equal-weighted basis.
In order to test the effectiveness of an investment strategy, we divided the back test universe into five equal groups (quintiles), according to the ratio we were testing. For example, when testing a the Magic Formula investment strategy, the back test universe was ranked from the best to the most expensive stocks.
The best ranked 20% of Magic Formula companies were put in the first quintile (Q1), the next in the second, and so on, with the 20% of companies with the worse Magic Formula ranking in the fifth quintile (Q5).
What returns did the Magic Formula investment strategy generate?
These were the returns the Magic Formula in Europe over the 12 year period from June 1999 to June 2011.
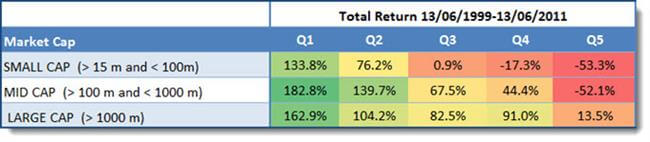
Source: Quantitative Value Investing in Europe: What works for achieving alpha
As you can see companies with the best Magic Formula rank (the best ranked companies), quintile 1 (Q1) in the above table, did a lot better than companies with the worse Magic Formula rank. It did this for small, medium and large companies.
Substantially better than the market - only +30.5%
The best Magic Formula investing companies all substantially outperformed the market which returned only 30.54% over the same 12 year period.
But you can substantially improve the returns of the Magic Formula strategy
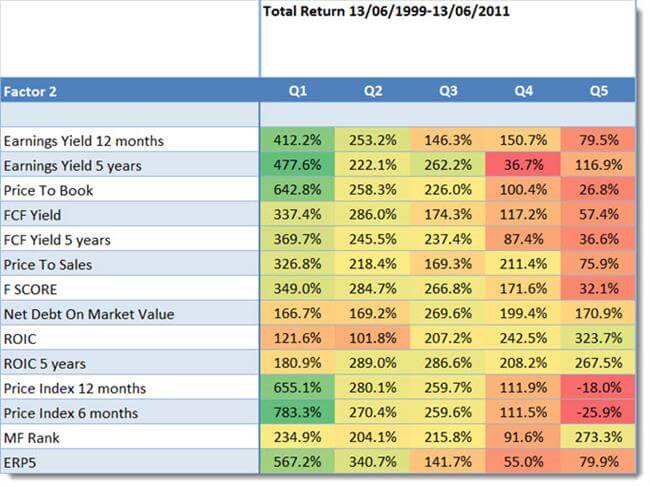
We also tested the Magic Formula investing strategy with a lot of other ratios and, as you can see in the table below, the returns of the strategy can be improved substantially.
Click image to enlarge
Source: Quantitative Value Investing in Europe: What works for achieving alpha
The returns you should look at are those in column Q1. They show the returns generated by first selecting the best Magic Formula companies (most undervalued) and then sorting them by the items in the Factor 2 column.
Best combination +783% was Momentum
This means you could have earned the highest return of 783.3% over 12 years if you invested in the best ranked Magic Formula companies that also had the highest 6 month price index (price momentum).
Screen for Magic Formula + Momentum stocks in your market
The Quant Investing screener has the Magic Formula rank built in. Add the Price Index 6m filter with two clicks and get a ranked list of the best Magic Formula companies with the strongest 6-month momentum — in whichever of the 17 Eurozone countries (or beyond) you invest in.
Try the Magic Formula + Momentum screener free
No credit card needed. Cancels automatically after 30 days.
Magic Formula and Momentum investment strategy in Europe - 2016 to 2023
To show just how well a Magic Formula and Momentum (Price Index 6 months) investment strategy works, here is the results of a back test of the strategy in Europe over the eight period from January 2016 to January 2023.
It is an update of the above back test which covered the 12-year period from 13 June 1999 to 13 June 2011. In case you were wondering about the missing period (2011 to 2015) we used the historical screener for this back test and its data only goes back to December 2015.
How the companies were selected
Here are the exact details of the back tested investment strategy:
- Countries - 17 Eurozone countries (Austria, Belgium, Cyprus, Estonia, Finland, France, Germany, Greece, Ireland, Italy, Luxembourg, Malta, the Netherlands, Portugal, Slovakia, Slovenia, and Spain)
- Exclude banks, insurance companies, investment funds, certain holdings companies, and REITS
- Exclude companies with an average 30-day trading volume of less than €10,000
- Portfolios formed on the first trading day of the year (Because the back test database is point in time there is not risk of look-ahead bias)
- Returns were compounded on an annual basis
- Select the 20% best ranked Magic Formula companies
- Sort the list by Price Index 6 months from high to low
- Buy the top 50 companies by Price Index 6 months on an equal weight basis
- Rebalance after one year
Magic Formula and Momentum investment strategy performance
Here are the summarised results:
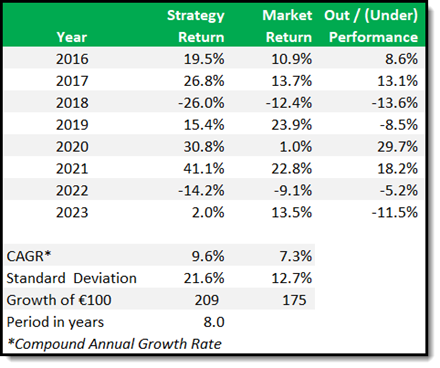
As you can see the strategy performed worse than the market in 2018, 2019 2022 and 2023 but performed great in all other periods. In spite of the underperformance it is still ahead of the benchmark EURO STOXX® Index overall and on a CAGR basis +9.6% compared to +7.4%.
This again shows you how important it is t:
- FIRST find an investment strategy you are comfortable with and
- SECOND stick to that strategy when it underperforms, even over a few years as happened here.
As you may already have seen, the formula does not always work, as mentioned and explained by this investor. You know, this happens to all investment strategies.
So my question to you is - would you have stayed with the strategy after the last two years of underperformance?
Find your own Magic Formula + Momentum investment ideas
The screener already has the Magic Formula screen saved — load it, add Price Index 6m as a secondary factor, set the slider to the top 20%, and you have a ranked list of candidates ready to review. Data covers 22,000+ companies across Europe and worldwide.
Start your free 30-day screener demo
No credit card needed. Cancels automatically after 30 days.
How to implement this strategy in your portfolio
To see exactly how to implement the Magic Formula investment strategy in your portfolio take a look at the following article:
How to implement the Magic Formula investment strategy: Your Step-by-Step Guide to Investment Success
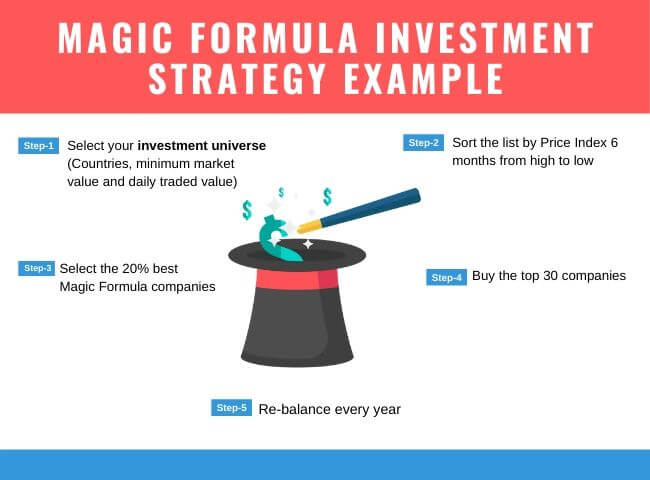
Magic Formula implementation example
Here is an example of a Magic Formula investment strategy for you to consider:
These Magic Formula articles may also interest you:
How to implement the Magic Formula investment strategy - World-wide
Does the Magic Formula also work in Finland?
Does the Magic Formula also work in Belgium, Luxembourg and the Netherlands?
Is this a better alternative to the Magic Formula?
How to get the best returns with Magic Formula investing
Ever heard of the price to book magic formula?
Please note: This website is not associated with Joel Greenblatt and MagicFormulaInvesting.com in any way. Neither Mr Greenblatt nor MagicFormulaInvesting.com has endorsed this website's investment advice, strategy, or products. Investment recommendations on this website are not chosen by Mr. Greenblatt, nor are they based on Mr Greenblatt's proprietary investment model, and are not chosen by MagicFormulaInvesting.com. Magic Formula® is a registered trademark of MagicFormulaInvesting.com, which has no connection to this website.