

Free Cash Flow (FCF) Yield and Momentum investment strategy
In our book Quantitative Value Investing in Europe: What Works for Achieving Alpha we tested 168 investment strategies in Europe over the 12 year period from June 1999 to June 2011.
One of the best performing single ratio investment strategies we tested was Free Cash Flow yield.
We also found a way to substantially increase the returns of a high free cash flow yield strategy and that is what this article is all about.
First a few definitions.
What is Free Cash Flow yield?
Free Cash Flow yield was defined trailing 12 months cash flow from operations minus capital expenditure, divided by enterprise value.
Just using Free Cash Flow yield
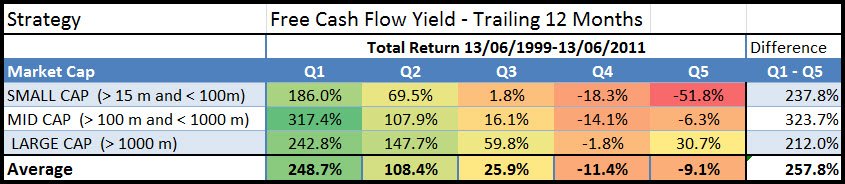
If you only used Free Cash Flow yield this is what your returns over the 12 year period from June 1999 to June 2011 would have looked like.
Click image to enlarge
Free Cash Flow Yield Trailing 12 months returns (Source: Quantitative Value Investing in Europe: What Works for Achieving Alpha)
Q1 (Quintile 1) shows the 20% of companies with the highest free cash flow yield and Q5 (quintile 5) the lowest or most expensive 20%.
Substantial market outperformance
Just in case you were wondering the free cash flow yield investment strategy substantially outperformed the market which returned only 30.54% over the period or 2.25% pa, dividends included.
How to improve the free cash flow investment strategy
We also tested Free Cash Flow Yield with 13 other ratios and indicators to see if that could increase returns.
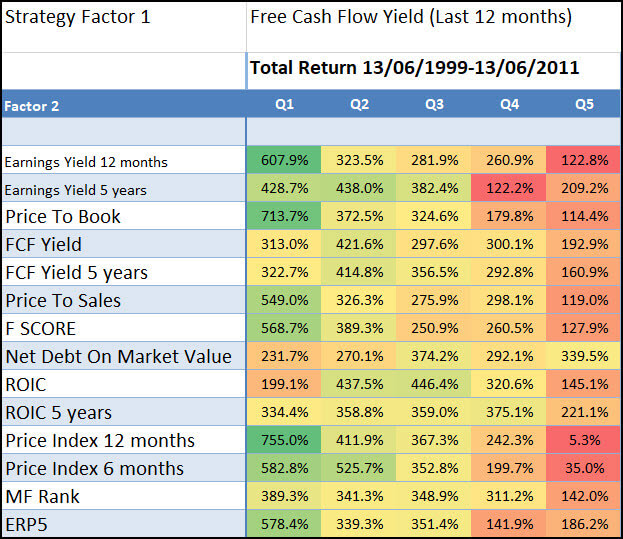
And it did, a lot, as you can see in the following table:
Click image to enlarge
Source: Quantitative Value Investing in Europe: What works for achieving alpha
Look at column Q1
Look at the returns in column Q1, it shows the returns generated by first selecting the 20% highest free cash flow yield companies combined with the ratios in the column called Factor 2.
Best combination +755% was Momentum (506.3% improvement)
As you can see the best way to increase the 12 year return to +755.0% was to combine free cash flow yield with Price Index 12 months (12 months momentum).
Price index 12 months is calculated as the current share price / share price 12 months ago.
This means if you invested only in the 20% of high free cash flow yield companies that also had the top 20% 12 months price index you could have increased your return by 506.3% (755.0% - 248.7%) compared to if you only invested in companies with the highest free cash flow yield.
That is a huge improvement I am sure you will agree!
Okay Free cash flow yield works how can I find investment ideas?
This is how you can find free cash flow yield with momentum investment ideas for your portfolio.
It’s already done for you
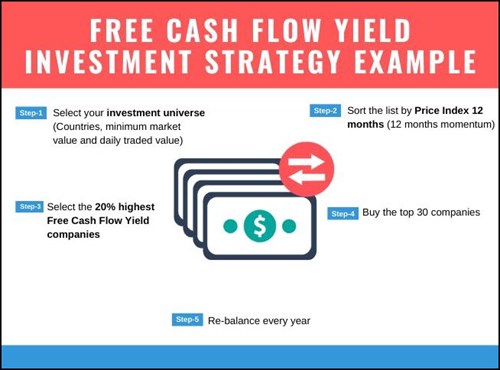
Here is an example of a free cash flow investment strategy:
Click here to start using the FCF Momentum investment strategy in your portfolio NOW!
We have already saved a free cash flow yield screen for you so all you have to do is load it with a few simple mouse clicks.
Here is how you do it:
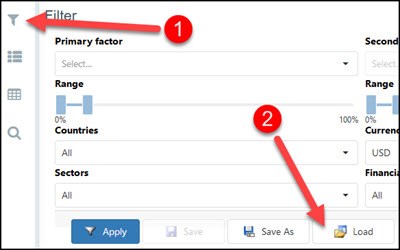
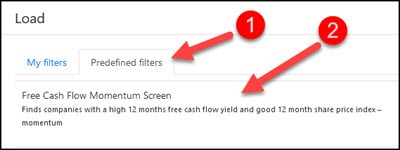
Log into the screener, click the Screener icon, and then click the Load button.
Click the Predefined filters tab. Scroll down the list then click on the Free Cash Flow Momentum Screen.
Once you have selected the screen click the Confirm button.
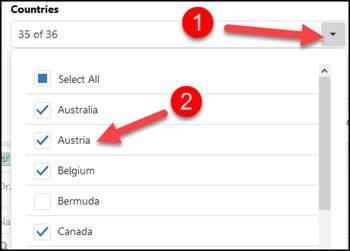
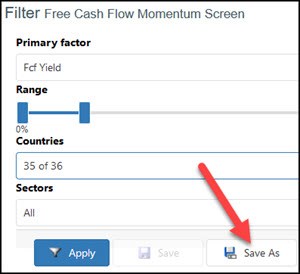
Select your countries
You then select the countries where you would like to search for investment ideas.
To do this click the drop down list item below Countries and check all the countries you would like to select.
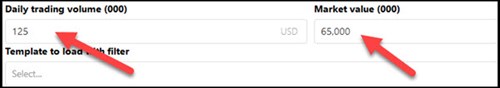
Select value and volume
Next you can select the minimum daily trading volume and the minimum market value of the companies you want to look for.
Important: The numbers you enter are in thousands, this means if you enter $100 it is equal to $100,000.
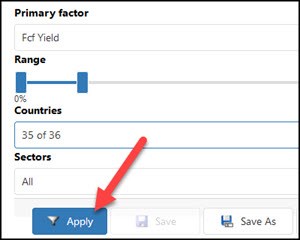
That is all you have to do.
When you are done click the Apply button to get investment ideas.
You can save all your screens
Once you have changed the basic free cash flow momentum screen to fit your needs you can save it so that you can call it up at any time with a few simple mouse clicks.
You can save as many screens as you like.
To save your screen click the Save As button.
Click here to start using the FCF Momentum investment strategy in your portfolio NOW!
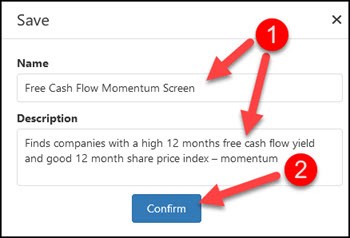
In the pop-up box change the screen name and description so you can remember the screen.
Click the Confirm button to save your screen.
Further reading:
Free cash flow yield back test
Why and how to implement a high free cash flow yield investment strategy
PS: To start using this investment strategy in your portfolio today sign up here
PPS: It’s so easy to put things off, why not sign up right now before it slips your mind. It costs less than an inexpensive lunch for two and if you don’t like it you get your money back (Click here to join now).
Click here to start using the FCF Momentum investment strategy in your portfolio NOW!