

ERP5 and Momentum Investment Strategy
The ERP5 investment strategy was developed by two friends, Philip Vanstraceele and Luc Allaeys when they set out to find a strategy that beats the Magic Formula investment strategy as described in the excellent book by Joel Greenblatt called The Little Book that Beats the Market.
How is ERP5 calculated?
The ERP5 investment strategy finds undervalued companies based on the following four ratios:
- Earnings Yield
- Return on invested capital (ROIC)
- Price to Book and
- 5 year average ROIC.
They named the strategy ERP5, based on the initials of the 4 factors ERP5.
To get the ERP5 ranking, all companies are ranked on each of the four ratios. These rankings are then added together to give the ERP5 value of the company.
Companies with the lowest ERP5 value or rank are the most attractive investment ideas.
What returns does it generate?
We tested ERP5 investment strategy in Europe over the 12 year period from June 1999 to June 2011.
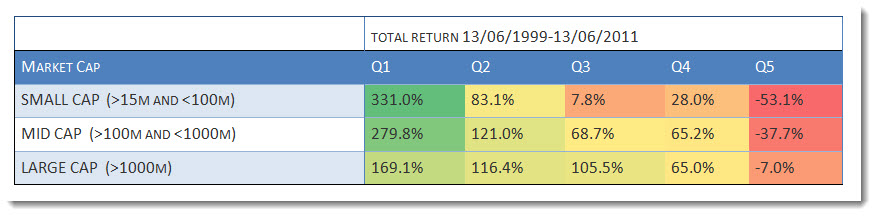
Click image to enlarge
Source: Quantitative Value Investing in Europe: What works for achieving alpha
As you can see companies with the best (low) ERP5 values (the best ranked companies), quintile 1 (Q1) in the above table, did a lot better than companies with a high ERP5 value, and did this for small, medium and large companies.
Substantially better than the market
The best ranked ERP5 companies all substantially outperformed the market which returned 30.54% over the same 12 year period.
Before I show you by how much it beats the Magic Formula investment strategy first some information on how we tested.
Click here to get the ERP5 strategy working in your portfolio NOW!
Methodology
We only use historical accounting data and no forecasts. The reason being is that there is ample evidence that forecasts cannot be relied on.
For example, in his excellent book, ‘The New Contrarian Investment Strategy’, David Dreman mentioned a study that used a sample of 67.375 analysts' quarterly estimates for companies listed on US stock exchanges.
The study found that the average analysts’ error was 40%, and that the estimates were misleading two-third of the time!
The back test universe and benchmark
Our back test universe is a subset of companies in the Datastream database containing an average of about 1500 companies in the 17 country Eurozone market during our 12-year test period (13 June 1999 to 13 June 2011).
We excluded banks, insurance companies, investment funds, certain holdings companies, and REITS.
We included bankrupt companies to avoid any survivor bias. Bankrupt companies, or companies that were taken over, returns were calculated using the last stock market price available before the company was delisted.
We excluded companies with an average 30-day trading volume of less than €10 000.
It wasn't a good time to invest in stocks
The test period was most certainly not a good time to be invested in stocks.
The 12-year period we tested included a stock market bubble (1999), two recessions (2001, 2008-2009) and two bear markets (2001-2003, 2007-2009).
In spite of all the substantial movements, over the whole period it was essentially a sideways market.
Holding periods and quintile tests
Each year all the portfolios were formed on 16 June. We used 16 June as most European companies have a December year-end and by this date all their previous year-end results would be available in the database. This avoids look-ahead bias.
The annual returns for our back test portfolios were calculated as the 12-month price change plus dividends received over the period. Returns were compounded on an annual basis.
This means each year the return of the portfolio (dividends included) was reinvested (equally weighted) in the strategy the following year.
The portfolios were all constructed on an equal-weighted basis.
In order to test the effectiveness of a strategy, we divided the back test universe into five equal groups (quintiles), according to the factor we were testing.
For example, when testing a low price-to-book (PB) value strategy, we ranked the back test universe from the cheapest (lowest PB) to the most expensive (highest PB) stocks.
The cheapest 20% of companies were put in the first quintile (Q1), the next in the second, and so on, with the 20 % of companies with the highest price-to-book value in the fifth quintile (Q5).
Does it beat the Magic Formula?
Over the same 12 year period mentioned above we also tested the Magic Formula (MF) investment strategy (applied to European companies) and this is what we found:
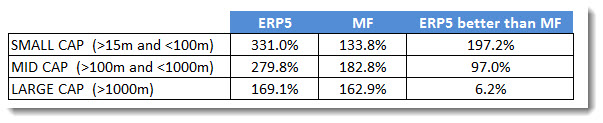
The table shows the total 12 year return of both strategies with the last column showing how much better the ERP5 strategy did compared to the Magic Formula.
ERP5 performed substantially better +200%
As you can see the ERP5 strategy, for all size companies, did substantially better than the Magic Formula, in fact for small companies if you would have had done nearly 200% better.
Click here to get the ERP5 strategy working in your portfolio NOW!
How you can improve the returns of the ERP5 strategy +735%
We also tested the ERP5 investment strategy with 13 other ratios and, as you can see in the table below, the returns of the strategy can be improved substantially.
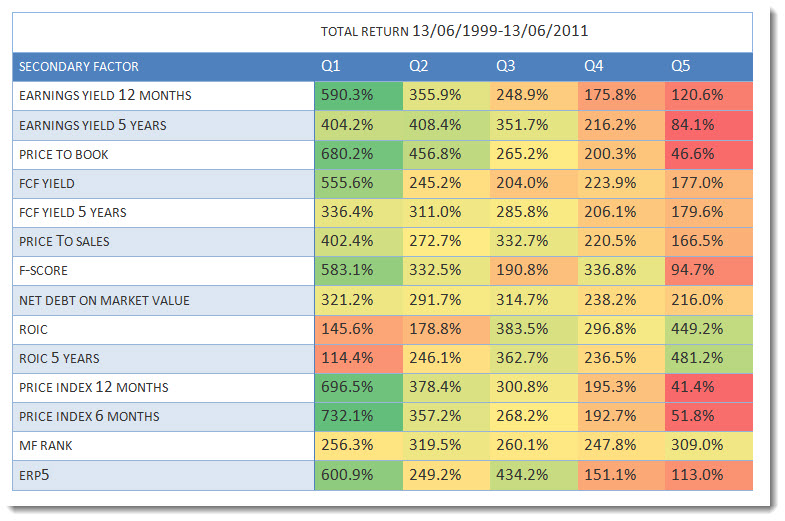
Click image to enlarge
Source: Quantitative Value Investing in Europe: What works for achieving alpha
Look at the returns in column Q1. They show the returns generated by first selecting the 20% best ERP5 companies (most undervalued) and then sorting them by the items in the Secondary Factor column and investing the top 20% of companies.
Best combination +732% was Momentum
This means you could have earned the highest return of 732.1% over 12 years if you invested in the best ranked ERP5 companies that also had the highest 6 month price index (price momentum).
Summary
As you can see the ERP5 investment strategy is something that deserves your attention because as a stand-alone strategy it has performed substantially better, not only than the market, but also better than the Magic Formula.
Not only that but if you combine the ERP5 strategy with other factors, such as 6 or 12 months price momentum you can substantially increase your returns.
How to implement the ERP5 Momentum investment strategy
To find out exactly how to implement this investment strategy in your portfolio, this article shows you exactly how: How and why to implement the ERP5 investment strategy in your portfolio
PS To start getting ERP5 and Momentum investment ideas for your portfolio right now sign up here.
PPS It is so easy to put things why don't you sign up now before it slips your mind?
Click here to get the ERP5 momentum strategy working in your portfolio NOW!
Please note: This website is not associated with Joel Greenblatt and MagicFormulaInvesting.com in any way. Neither Mr Greenblatt nor MagicFormulaInvesting.com has endorsed this website's investment advice, strategy, or products. Investment recommendations on this website are not chosen by Mr. Greenblatt, nor are they based on Mr Greenblatt's proprietary investment model, and are not chosen by MagicFormulaInvesting.com. Magic Formula® is a registered trademark of MagicFormulaInvesting.com, which has no connection to this website.