

SMA stands for Simple Moving Average (SMA). It is variable so you can set exactly the value you want, for example, 20, 50, 200 trading days.
So you can choose the number of trading days you would like to see.
How is it calculated?
The variable Simple Moving Average ratio is calculated as:
Current stock closing price / Simple Moving average value.
What it means
A simple moving average value of greater than one means the closing stock price is above the Simple Moving Average you selected.
A value less than one means the last closing stock price is below the Simple Moving average.
You can thus use it to only see companies that are trading above their 50 day simple moving average.
How to add a SMA indicator
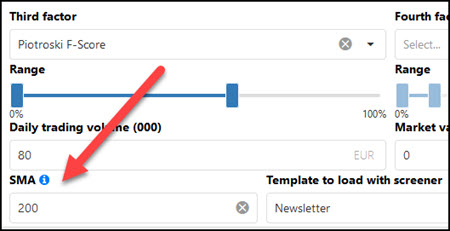
It is very easy to add your own SMA indicator to any of your screens. Simply type the number of trading days in the box below SMA, 200 days is shown below.
Note: Due to the added calculations, adding a SMA indicator to your screen will make the screener response time a bit slower.
An SMA output column is automatically added
After adding a SMA value, as soon as you click the Apply button the SMA column will automatically be added to the results of your screen.
The same as all columns in the screener you can sort this column by clicking on the column heading – SMA in this case. Clicking once will sort the column from low to high. Clicking a second time will sort the column from high to low.

Remember:
A SMA value of >1 means the closing stock price is above the SMA you selected.
A SMA value of <1 means the last closing stock price is below the SMA.
Click here to start using the Simple Moving Average you use to find investment ideas NOW!