

Earnings Yield and Momentum investment strategy
Estimated Reading Time: 6 minutes
In this blog post, you'll discover a powerful investment strategy combining Earnings Yield and Momentum.
You'll learn why Earnings Yield (EBIT/Enterprise Value) is a top valuation metric and how back-tested data shows it consistently delivers superior returns, especially for medium to large companies.
By combining Earnings Yield with a momentum indicator like the 6-month price index, you can significantly increase your returns.
The post provides a step-by-step guide to implementing this strategy in your portfolio, helping you maximize gains while managing risks.
Earnings Yield (Earnings before Interest and Taxes (EBIT) / Enterprise Value) is one of the best, if not the best valuation ratio you can use. Numerous research reports have compared it to other ratios, over most time periods, and it will nearly always give you the best return.
A return example
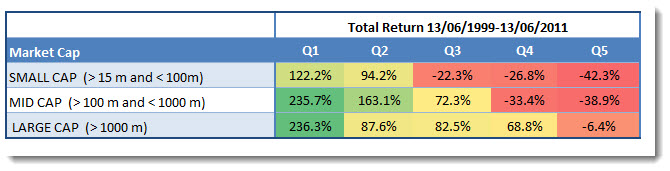
For example, here are the back tested returns you could have earned if you used Earnings Yield to invest in Europe over the 12 year period 13 June 1999 to 13 June 2011.
Click image to enlarge
Source: Quantitative Value Investing in Europe: What works for achieving alpha
Q1 (Quintile 1) represents the cheapest 20% of companies in terms of Earnings Yield (EY) and Q5 (quintile 5) the most expensive.
Best for medium to large companies
As you can see the strategy worked best for medium and large companies (look at the Q1 returns).
Before I show you how you can improve this investment strategy first some information on how we tested.
Methodology
Here is what we did to back test the strategy.
We only use historical accounting data and no forecasts. The reason being is that there is ample evidence that forecasts cannot be relied on. For example, in his excellent book, ‘The New Contrarian Investment Strategy’, David Dreman mentioned a study that used a sample of 67,375 analysts' quarterly estimates for companies listed on US stock exchanges.
The study found that the average analysts’ error was 40%, and that the estimates were misleading two-third of the time!
The back test universe and benchmark
Our backtest universe is a subset of companies in the Datastream database containing an average of about 1500 companies in the 17 country Eurozone market during our 12-year test period (13 June 1999 to 13 June 2011).
We excluded banks, insurance companies, investment funds, certain holdings companies, and REITS.
We included bankrupt companies to avoid any survivor bias. Bankrupt companies, or companies that were taken over, returns were calculated using the last stock market price available before the company was delisted.
We excluded companies with an average 30-day trading volume of less than €10 000.
It was not a good time to invest in stocks
The test period was most certainly not a good time to be invested in stocks. The 12-year period we tested included a stock market bubble (1999), two recessions (2001, 2008-2009) and two bear markets (2001-2003, 2007-2009).
In spite of all the substantial movements, over the whole period it was essentially a sideways market, as Vitaliy Katsenelson defined in his book, ‘The Little Book of Sideways Markets’.
Holding periods and quintile tests
Each year all the portfolios were formed on 16 June. We chose 16 June as most European companies have a December year-end and by this date all their previous year-end results would be available in the database.
The annual returns for our back test portfolios were calculated as the 12-month price change plus dividends received over the period. Returns were compounded on an annual basis.
This means each year the return of the portfolio (dividends included) would be reinvested (equally weighted) in the strategy the following year.
The portfolios were all constructed on an equal-weighted basis.
In order to test the effectiveness of a strategy, we divided our back test universe into five equal groups (quintiles), according to the factor we were testing. For example, when testing a low price-to-book (PB) value strategy, we ranked our back test universe from the cheapest (lowest PB) to the most expensive (highest PB) stocks.
The cheapest 20% of companies were put in the first quintile (Q1), the next in the second, and so on, with the 20 % of companies with the highest price-to-book value in the fifth quintile (Q5).
How you can improve the strategy - a LOT!
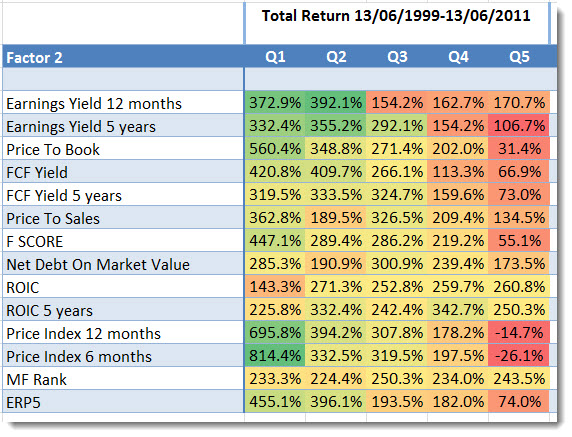
You can improve your returns substantially if you combine an Earnings Yield investment strategy with another ratio or indicator as the table below clearly shows.
In the test below we first selected the 20% of companies with the highest Earnings Yield, then split this group of companies into Q1 to Q5 based on the indicator or ratio in the Factor 2 column.
This was the result:
Click image to enlarge
Source: Quantitative Value Investing in Europe: What works for achieving alpha
Screen for Earnings Yield and Momentum stocks now
The screener has both Earnings Yield (EBIT/EV) and Price Index 6-month built in. You can run this exact two-factor strategy across 22,000+ companies in Europe and worldwide — the same methodology used in the backtest above.
Find high Earnings Yield stocks with strong momentum
No credit card needed. Cancels automatically after 30 days.
Best combination – Momentum +578% improvement
The best way to increase your returns +578.1% (814.4% - 236.3%) was to combine Earnings Yield with Price Index 6 months (6 months momentum).
Combining it with Price Index 12 months (12 months momentum) also worked great!
How to implement this - value momentum - strategy in your portfolio
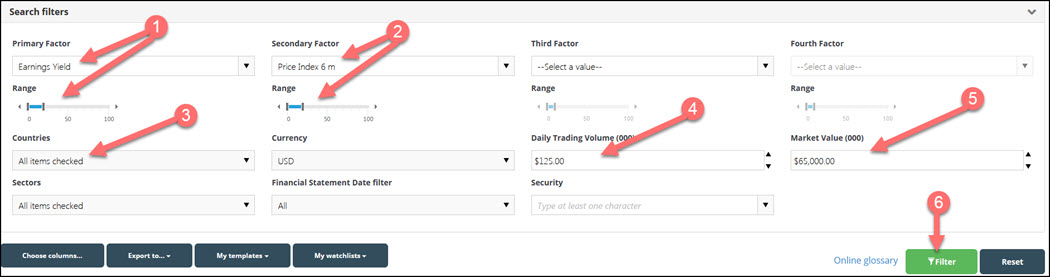
This is how you can implement this strategy in your portfolio using the screener:
- As the first factor select the 20% of companies with highest earnings yield (EBIT/Enterprise value)
- As a second factor select the 20% of companies with the highest Price Index 6m (six months price momentum)
- Select the countries where you would like to invest
- Set your minimum trading value per day - $125,000 in the image below
- Select the minimum market value of companies you would like to look for - $65m in the image below
- Click on the filter button to run your screen
This is what you stock screen should look like:
Click image to enlarge
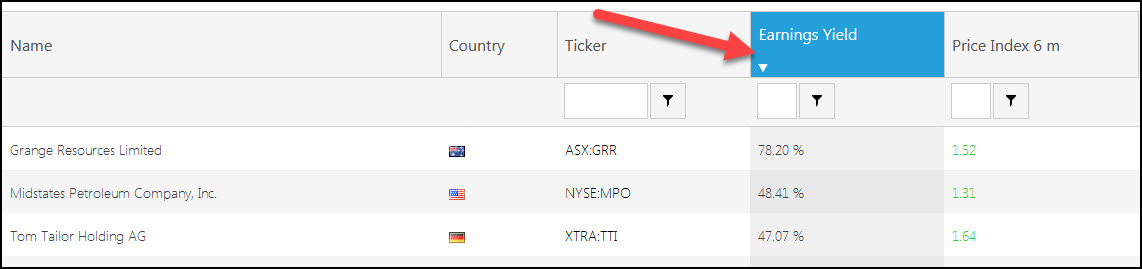
In the results table click on the Earnings Yield column heading twice to sort the companies by earnings yield from high to low (the higher the Earnings Yield the more undervalued the company).
Click image to enlarge
You now have a list of companies that fits this the Earnings Yield Momentum investment strategy.
Limit your losses
We strongly recommend that you use a strategy to keep your losses low. You can read more about exactly how to do that here: Truths about stop-losses that nobody wants to believe
Exact definition – in glossary
You can see the exact definition of all the ratios and indicators in the Glossary
Put the Earnings Yield momentum strategy to work in your portfolio
Follow the exact steps above using the free demo screener: select the top 20% by Earnings Yield, then rank by 6-month Price Index. Set your country, market cap, and minimum trading volume filters and run the screen in under two minutes.
Run the Earnings Yield and Momentum screen free
No credit card needed. Cancels automatically after 30 days.