

Momentum and Price to Book investment strategy
Last updated: April 2026
Momentum + Price to Book strategy — definition:
A two-factor stock selection strategy that first screens for the cheapest 20% of companies by Price to Book ratio (current share price ÷ book value per share), then selects the top performers by 6-month or 12-month share price momentum (Price Index). Back-tested across 1,500 European companies from June 1999 to June 2011, the combined strategy returned +1,157.5% vs the market's +30.5%.
Key Findings:
- +1,157.5% return over 12 years (Jun 1999–Jun 2011) vs market return of +30.5%
- +23.5% average annual return vs +2.3% pa for the market index
- Combining 6-month momentum with low Price to Book outperformed 12-month momentum
- Strategy outperformed Price to Book + Piotroski F-Score (+685.2%) as the second-best combination
- Universe: ~1,500 companies, 17-country Eurozone, bankrupt companies included to avoid survivor bias
Momentum also called Price Index (PI) is a great ratio to increase your investment returns as it let you profit from the upward moving momentum of a company’s stock price.
Momentum has been tested in numerous research papers, over long periods of time, and it outperforms the market.
In this article we tested a value momentum investment strategy by combining six months momentum with low Price to Book companies.
These are the steps to implement the strategy:
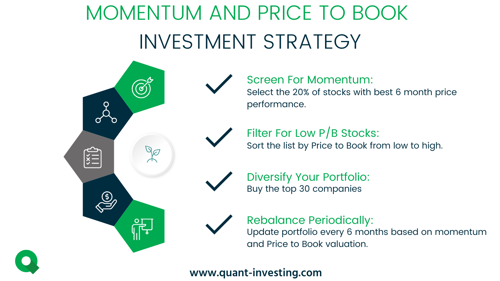
Learn how to combine momentum and Price-to-Book to find high-performing stocks and maximise returns with this systematic investment strategy.
The Backtest Universe and Benchmark
Our backtest universe was a subset of companies in the Datastream database containing an average of about 1500 companies in the 17 country Eurozone market over the 12-year test period from 13 June 1999 to 13 June 2011.
We excluded banks, insurance companies, investment funds, holdings companies, and REITS.
We included bankrupt companies to avoid any survivor bias. For bankrupt companies, or companies that were taken over, returns were calculated using the last stock market price available before the company was delisted.
We excluded companies with an average 30-day trading volume of less than €10,000.
It was not a good time to invest in stocks
The test period was most certainly not a good time to be invested in stocks.
The 12-year period we tested included a stock market bubble (1999), two recessions (2001, 2008-2009) and two bear markets (2001-2003, 2007-2009).
In spite of the big movements, over the back test period it was essentially a sideways market.
Holding periods and quintile tests
Each year all the portfolios we tested were formed on 16 June. We chose 16 June as most European companies have a December year-end and by this date all their previous year-end results would have been published.
The annual returns for our back test portfolios were calculated as the 12-month price change plus dividends received over the period. Returns were compounded on an annual basis. This means each year the return of the portfolio (dividends included) was reinvested (equally weighted) in the strategy the following year.
The portfolios were all constructed on an equal-weighted basis.
In order to test the effectiveness of a strategy, we divided our back test universe into five equal groups (quintiles), according to the factor we were testing.
For example, when testing a low price-to-book (PB) value strategy, we ranked our back test universe from the cheapest (lowest PB) to the most expensive (highest PB) stocks.
The cheapest 20% of companies were put in the first quintile (Q1), the next in the second, and so on, with the 20% of companies with the highest price-to-book value in the fifth quintile (Q5).
Momentum Returns and Improvements
We tested both single ratios and a combination of ratios. As you will see single ratio returns can be substantially improved by adding a second ratio.
But before we get to that here are the back tested returns you could have earned if you used a high Price Index investment strategy to invest in Europe over the 12 year period 13 June 1999 to 13 June 2011.
Price Index 6 months
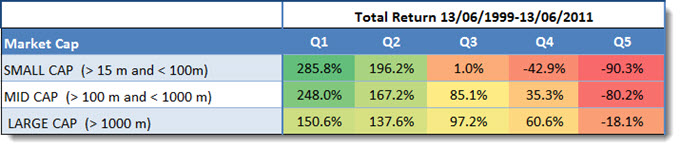
Source: Quantitative Value Investing in Europe: What works for achieving alpha
Price Index 12 months
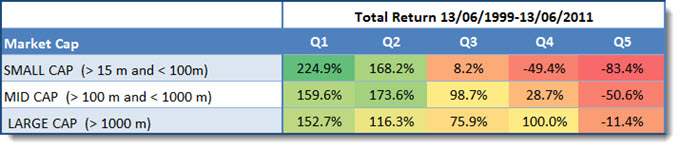
Source: Quantitative Value Investing in Europe: What works for achieving alpha
Q1 (Quintile 1) represents the 20% of companies with the highest Price Index (share price has gone up the most) and Q5 (Quintile 5) companies with the lowest Price Index (share price has gone up the least or fallen the most).
Market return +30.54%
For both strategies the highest Price Index companies (Q1) substantially outperformed the market, which over the same 12 year period returned 30.54%.
As you can see the strategies worked best for small companies.
You can get a LOT higher returns
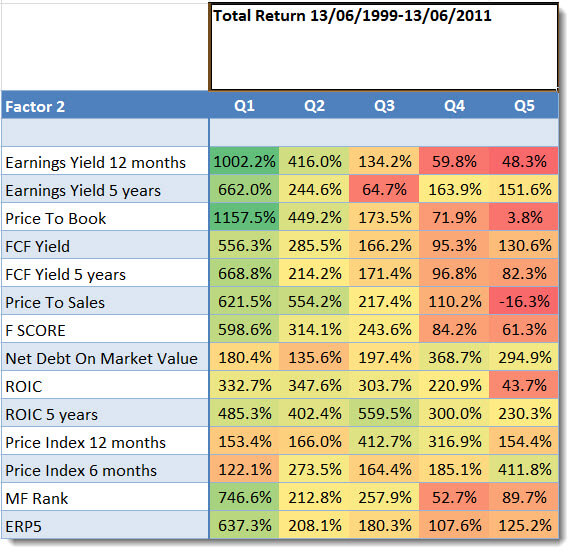
But you can improve your returns substantially if you combine the Price Index with another ratio as the table below shows:
Price Index 6 months (highest 6 month Price Index companies combined with)
Click image to enlarge
Source: Quantitative Value Investing in Europe: What works for achieving alpha
Best combination – Price to Book (PB) +1158%
The best way to increase your returns was to combine 6 month PI with low Price to Book value companies - undervalued companies.
Screen for low Price to Book companies with strong momentum
The back test shows that combining 6-month momentum with the cheapest 20% of companies by Price to Book produced a 12-year return of +1,157.5%. The Quant Investing screener lets you replicate this exact two-factor screen across 22,000+ companies — sort by Price to Book, filter by 6-month or 12-month Price Index, and build a watchlist in minutes.
Try the momentum + Price to Book screen free
No credit card needed. Cancels automatically after 30 days.
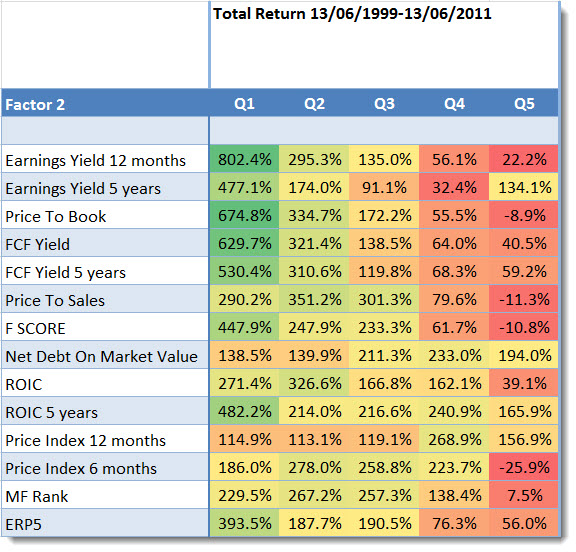
Price Index 12 months (highest 12 month Price Index companies combined with)
Click image to enlarge
Source: Quantitative Value Investing in Europe: What works for achieving alpha
Best combination – 12 month PI The best way to increase your returns was to combine 12 month PI with the 20% of companies with highest Earnings Yield (EBIT/Enterprise Value). This would have given you a total return of 802.4%!
Your second best strategy would have been to combine 12 month Price index with low Price to Book value companies.
Price Index 6 month the better strategy
You can however see that the 6 month Price Index would have given you much higher returns.
Backtest Updated 2015 to 2022
We updated the backtest combining six months momentum (Price Index 6 months) with low price to book stocks here:
Momentum Meets Value: Europe's Stunning +1157.5% Strategy Updated!
Momentum price to book strategy example
Here is an example of a momentum Price to book investment strategy example:
Exact definition – in glossary
You can find the exact definition of all the ratios and indicators use in the back test in the Glossary.
Be careful! – Price-to-Book has long periods of under-performance
Although the Price to Book ratio is a good valuation ratio it also has long periods of under-performance, please take a look at the following article: Be careful of this time tested value ratio
To screen use Book to Market NOT Price to Book
When searching for low Price to Book companies it is better to use the Book to Market ratio (the inverse of Price to Book) to see why read the following article: Why use book to market and not price to book?
Put this value-momentum strategy to work in your portfolio
The Quant Investing screener includes Price to Book, 6-month and 12-month Price Index (momentum), and the Piotroski F-Score — all the ratios tested in this back test. You can run this exact screen on 22,000+ companies across Europe, North America, and Asia, and set up automatic email alerts when new stocks enter the strategy criteria.
Start your free 30-day momentum + value screen
No credit card needed. Cancels automatically after 30 days.