

Shareholder Yield Letter
Track Record
Last updated: May 2026
Shareholder Yield Letter — definition:
A monthly investment newsletter recommending three large companies that return cash to shareholders through dividends and share buybacks. Based on James O'Shaughnessy's Shareholder Yield strategy, tested over 80 years of US market data (1927–2009), which beat the market on 97% of rolling 10-year periods. Applied to the Market Leaders universe. 20% trailing stop-loss on every position. New buying stops when the MSCI World index falls below its 200-day moving average. Published since 16 May 2023.
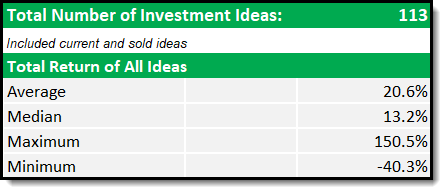
The first issue of the Shareholder Yield Letter went out on 16 May 2023. As of May 2026 the newsletter has produced 128 ideas across three full years. The performance data below covers all recommendations through 31 December 2025. A complete performance update including all first half 2026 results is scheduled for early July 2026.
The Shareholder Yield Letter's Performance
(Started in May 2023)
This is the performance of all the newsletter’s recommendations since the first company was added in May 2023.
How Returns Are Calculated:
- Total return = price change + dividends
- Measured in the currency of the company’s main listing
Returns are calculated as price change plus dividends in the currency of the company's main listing.
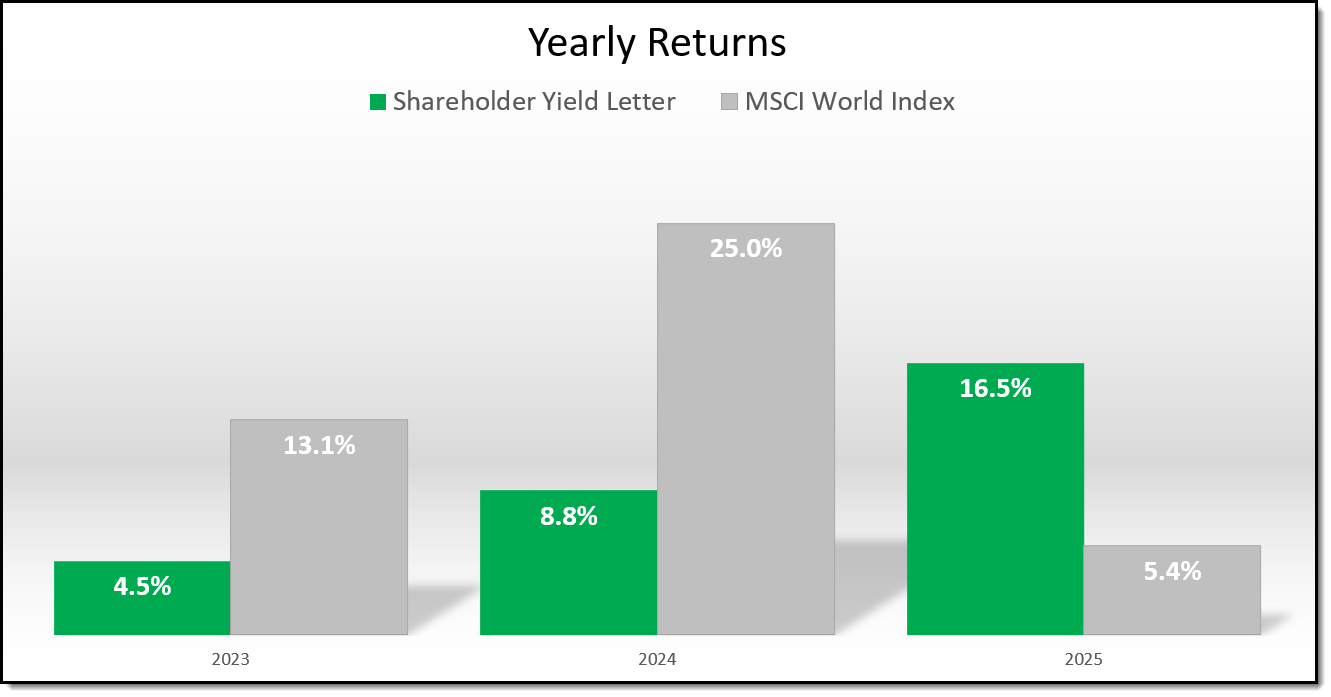
Yearly Returns
The following chart shows the average yearly returns (price gains + dividends) of all ideas in the portfolio.
In 2025 the newsletter’s performance caught up nicely with 2023 and 2024 when it the lagged the index because the strong performance of US technology companies and the strong US Dollar.
Both effects reversed in 2025. The S&P 500 returned a respectable +17.8% but the US Dollar declined 11.8% against the Euro which caused the low MSCI World return in Euro.
Click image to enlarge
A Strategy That Avoids Overvalued Stocks
The newsletter focuses on high Shareholder Yield companies—those that return cash to investors through dividends and buybacks. This means it deliberately avoided overvalued tech stocks and AI companies that require constant reinvestment.
Because the Magnificent 7 stocks drove much of the market’s gains in 2023 and 2024, the newsletter didn’t capture those returns.
In 2025 this trend reversed and the newsletter delivered strong returns.
Why Patience Pays Off: The Base Rate
A conservative approach that returns cash to shareholders now may lag in certain years, but the story isn’t over. To understand how a strategy performs long-term, you must look at the base rate, the historical probability of success.
Jim O’Shaughnessy explains this well in his article 7 Traits for Investing Greatness, where he analysed 80 years of data (1927–2009) on Shareholder Yield stocks.
“In the stock market, I believe the surest way forward is to look at the long-term results for an investment strategy and how often - and by what magnitude - it beat its underlying benchmark.”
The following table shows you the results of simply buying the 10% of large stocks with the highest Shareholder Yield (dividend yield plus net stock buybacks) over an 80-year back test period:
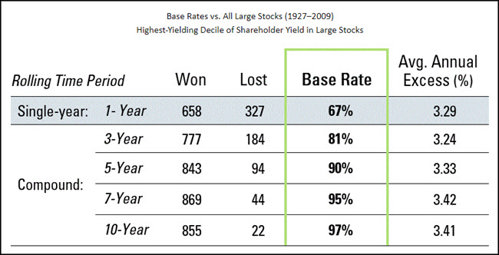
Source: 7 Traits for Investing Greatness
Key Findings from 80 Years of Data:
| Rolling period | % of periods strategy beat the market | Average outperformance per year |
|---|---|---|
| 3-year rolling | 81% | +3.24% per year |
| 10-year rolling | 97% | +3.41% per year |
Source: James O'Shaughnessy, 7 Traits for Investing Greatness. Universe: top 10% of large US stocks ranked by Shareholder Yield. Period tested: 1927–2009.
That’s an outstanding long-term edge.
While short-term performance can vary, history shows that patience with this strategy leads to strong results.
See the current Shareholder Yield Letter portfolio
If a strategy with a 97% rolling 10-year win rate over 80 years of US data fits how you want to invest for income, the Shareholder Yield Letter brings you three new ideas every month. Each one includes an executive summary, a valuation table, and a full company write-up.
See the Shareholder Yield Letter
30-day money-back guarantee. No questions asked.
Dividend Income
As the main criteria of the newsletter is Shareholder Yield (Dividend Yield + Stock Buyback Yield) we do not specifically look for companies with a high dividend.
But as the back tests have shown these companies on average also pay attractive dividends.
This is the dividend return of the newsletter:
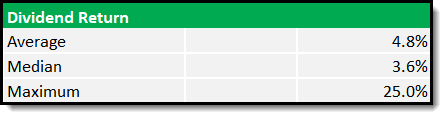
Average dividend return of all ideas
How the Newsletter Manages Risk
Successful investing is about cutting losses fast and letting winners run.
This is why the newsletter follows a strict 20% trailing stop-loss system.
Chart Showing percent of all recommended companies:
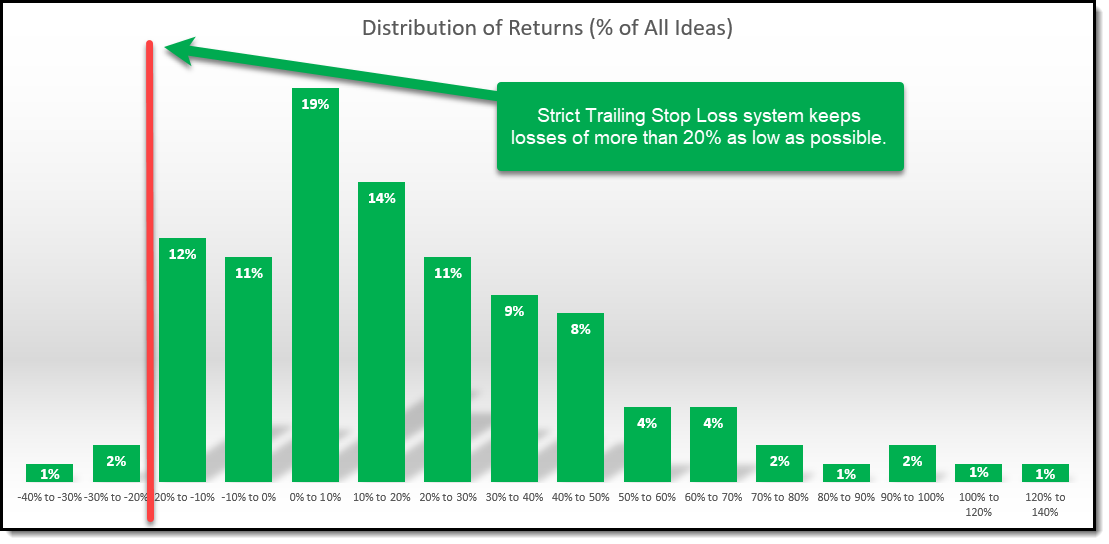
Distribution of newsletter returns – Percent of all ideas
Click to enlarge
Over 3 to 1 More Winners Than Losers
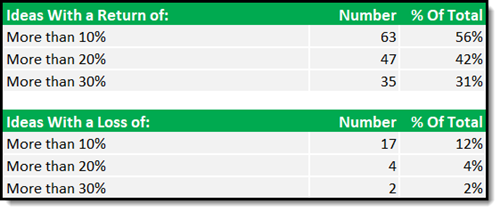
3.1 times more winners over 10% than losers
As you can see the positive returns FAR outnumber negative returns.
For example, returns of more than 10% is 3.7 (63/17) times higher than losses of more than 10%.
This is because of three things:
• A proven time-tested investment strategy
• The strict stop loss system to limit downside
• Avoid new investments during market downturns
Results So Far
74% (nearly three-quarters) of all recommended stocks had positive returns.
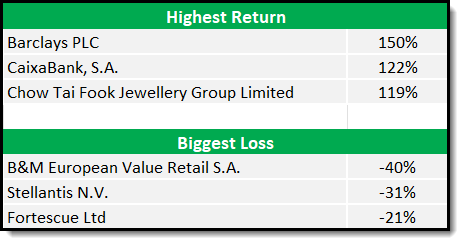
Here is a table with the best and worst performers to date:
Final Thoughts
It’s still early, but performance has been strong and is moving in the right direction, including a dividend yield of just under 5%.
Stay patient. Stick to the strategy. The best results come over time.
Subscribe and start investing for income
74% of recommended stocks have produced positive returns to date. The newsletter delivers three new large-cap, cash-returning companies every month, plus the dividend income that builds quietly in the background.
Subscribe to the Shareholder Yield Letter
30-day money-back guarantee. No questions asked.
What you get every month
When you subscribe to the Shareholder Yield Letter you receive three new recommendations every month, each with an executive summary, valuation table, and full company write-up. Subscribers also get my reasoning for every sell, the running portfolio, and the monthly market-regime check on the MSCI World 200-day moving average.
Only Thing Left for You To Do
We have shown you why the Shareholder Yield Letter works and how it can make a difference in your portfolio. If you have not already it’s time to take the next step. Join us today and start investing with confidence and clarity.
It costs less than an inexpensive lunch for two and if you do not like it, you get your money back – no questions asked.
PS It is so easy to put things off and forget, so why not sign up right now while it is still fresh in your mind.