

Quant Value Newsletter
Over 15 Year Track Record
Last updated: 31 December 2025
The Quant Value Newsletter's 15.5 Year Track Record (Started in July 2010)
This is the performance of all the ideas in the newsletter since we recommended the first company 15 and a half years ago on 1 July 2010.

Loss of 86.1% occurred in before the Stop Loss system was implemented
Returns are calculated as price change plus dividends in the currency of the company's main listing.
Includes returns of Crash portfolios.
Total Investment Ideas: The total number of ideas recommended is 655. This includes both current and all sold ideas. This is a LOT of ideas, giving you a large well diversified portfolio.
Average Return: The average return on all ideas is 23.2%. This is a strong performance that significantly exceeds historical average stock market returns.
Median Return: The median return is 11.3%. The median is the middle value when all returns are lined up from the smallest to the largest. A median shows you that half of the ideas yielded returns that are less than 11.7%, and half yielded higher returns.
Yearly Returns
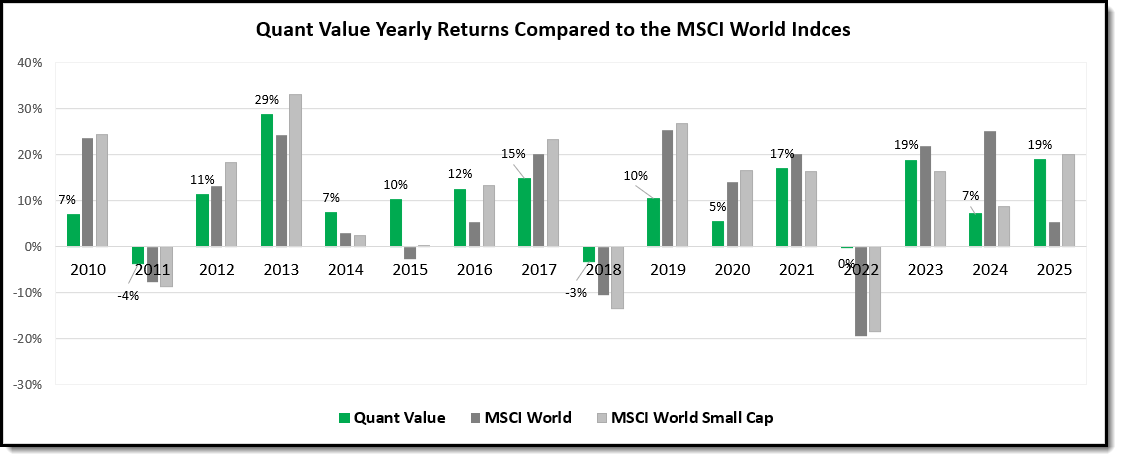
The following chart shows the yearly returns (price return and dividends) for all companies in the portfolio for a given year.
Click image to enlarge
As you can see the newsletter’s returns largely follow those of the indices BUT with a lot less volatility, especially on the downside. This is valuable because it helps you stick to the newsletter’s strategy in tough times. This is when most investors quit because of the pain of large negative returns being so large. This leaves them no chance to recover as they are out of the market.

Performance of the newsletter compared to the MSCI World and Small Cap stock market indices
Std Dev = Standard Deviation of all yearly returns
CAGR = Compound Annual Growth Rate
Sharpe Ratio = Average Return / Std Dev (Risk adjusted return measure)
Returns are about the same as the indices BUT the newsletter has about half the volatility of the market, this is a lot! And this helps your compound annual growth rate (the return that really matters) because it doesn't have to make up for huge negative returns the market suffered.
The much higher Sharpe Ratio clearly shows how the newsletter generates its returns with a lot lower risk.
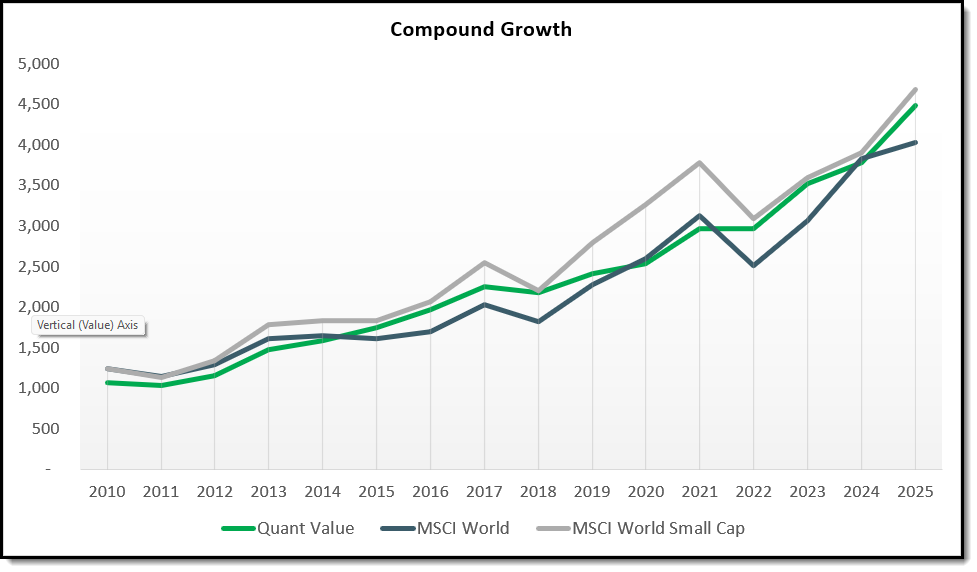
The following chart shows you just how valuable low volatility returns are.
Click image to enlarge
Double Your Money Every 7 Years
A 10.1% yearly return means you will double your money every 7.1 years.
That is what I like about this investment strategy and why I use it in my own portfolio:
- Drawdowns are low when the markets take a dive
- Your portfolio does not look like the market at all – all undervalued quality companies with momentum that no one has heard of.
- Worldwide diversification away from overvalued markets.
- A nice dividend to cover costs.
- You double your money in just under 7 years.
Just like you I know that it won’t beat the best performing market every year, but I do not care because I know the strategy (great track record) and what kind of companies it selects.
But most importantly – no one and I really mean NO ONE knows what index will perform best.
As an example, let me ask you: What index will perform best this year? The S&P 500? If you think that, will you put all your money in the index NOW and hold it for the whole of the year? Do you see just how hard it is to do.
That is why following a great strategy you trust is the best thing you can do.
How Far Winners Beat Losers - Over 3.6 to 1

3.5 times more winners over 20% than losers
As you can see the positive returns FAR outnumber negative returns.
For example, returns of more than 20% is 3.6 (273/76) times higher than losses of more than 20%.
The high-percentage returns (over 50% and 100%) furthermore shows that the newsletter had a significant number of high return investments.
Losses over 20%, shows you the strategy is not without risk. What investment strategy is not. However, the proportion of losses is small compared to the successful investments.
This is because of three things:
- A great time-tested investment strategy
- The strict stop loss system
- Stop buying when markets fall
Dividend Income
Even though we do not look at dividend yield when choosing ideas, an attractive dividend is an added bonus when you buy undervalued companies.
You thus get paid to wait as stock prices increase.

Average divided return of all ideas
Distribution of Returns
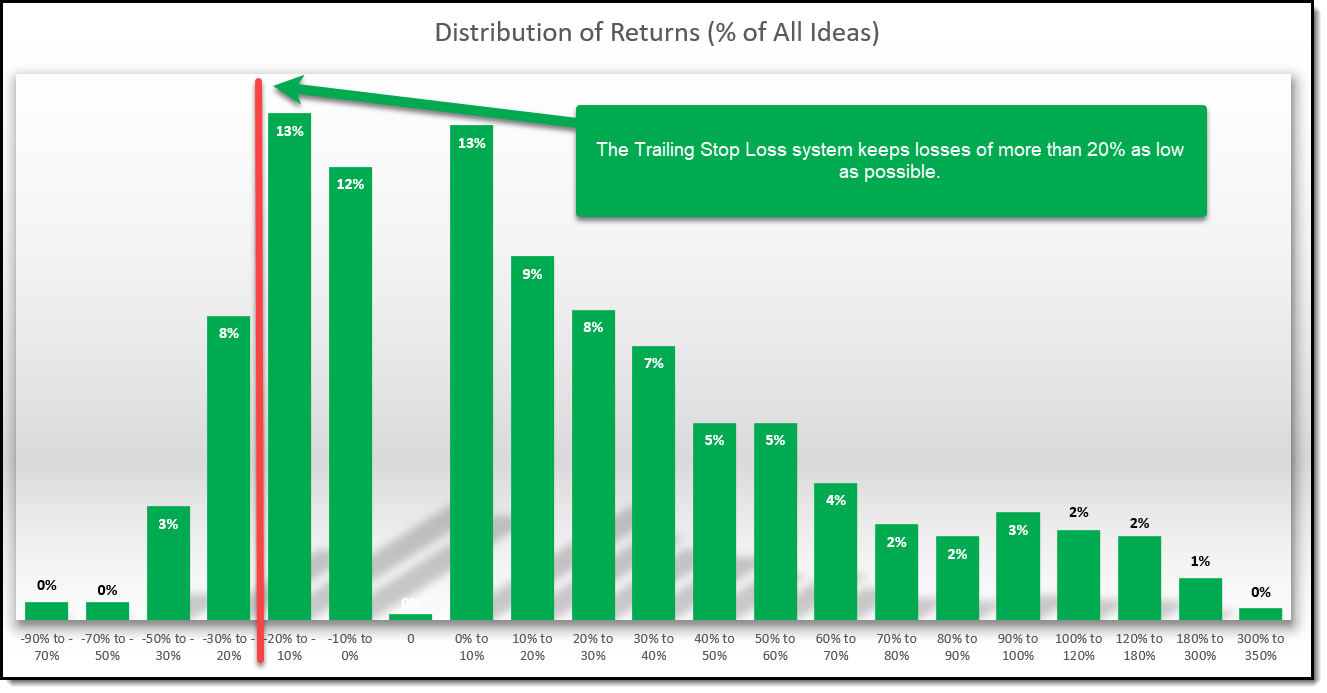
This is the most important chart!
You know investing works best when you cut your losses fast and let your winners run. To do this the newsletter follows a STRICT 20% trailing stop loss system.
The following two charts show you how successful the newsletter has been at doing this.
Over 15.5 years 64%, just under two third of all ideas, would have given you a positive return, with the highest return of 317.5% (the second highest was +315.5%).
Click image to enlarge
Distribution of newsletter returns – Percent of all ideas
The Stop-Loss System Works!
You can clearly see the stop loss system works.
Since March 2015, when it was implemented, only 24 of the 655 (3.7%) ideas lost more than 30%.
This happened because of large sudden price drops (before the stop-loss system can sell), for example, after a profit warning, legal action, stock suspension or fraud announcement.
The stop loss system lets you avoid the left-hand side returns (losses in the chart above).
This is very important because:
- You feel comfortable investing in companies you do not know. It is easier to get in if you know you can get out.
- You avoid the emotional pain of a large losses. This helps you stick to the investment strategy.
Not a Subscriber Yet? – Only one thing left for you to do
We have showed you exactly why and how the Quant Value newsletter outperforms the market, the only thing you have to do to get these market beating ideas working in your portfolio is to take a few minutes and subscribe.
It costs less than an inexpensive lunch for two and if you do not like it you get all your money back – no questions asked.
PS Why not sign up right now while it’s still fresh in your mind.