

The Adjusted Slope 90 days indicator is equal to the annualized exponential regression slope multiplied by the coefficient of determination (R2) over the past 90 trading days.
What is means in easy to understand English
In easy to understand English, the Adjusted Slope 90d shows you how much the share price of a stock could increase over a year if you assume the increase over the past 90 trading days continues for the remainder of the year. AND this value is adjusted for how well the calculated increase matches the real increase in the stock price.
Where can you find it?
In the screener you can use the Adjusted Slope 90d indicator either as a primary factor or as a column in the results of your screen.
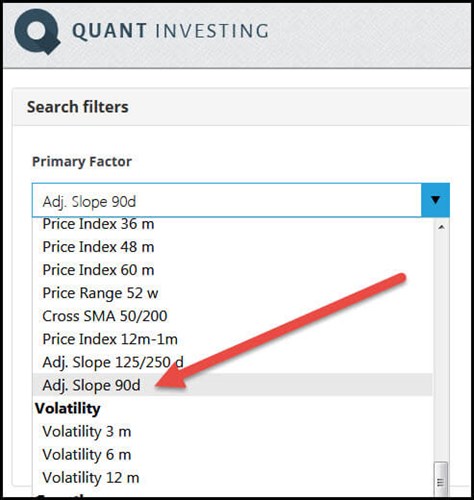
How to select Adjusted Slope 90d as a primary screening factor
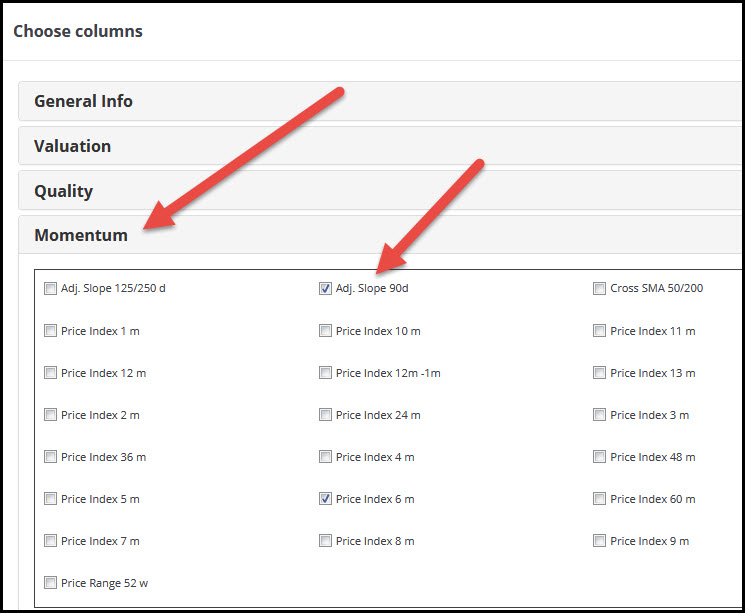
How to select Adjusted Slope 90d as an output column
What is good and what bad?
The higher the Adjusted Slope 90d value the better as it means the share price has increased a lot over the past 90 trading days and that the calculated increase in the stock price closely fits the real increase in the stock price.
You can select the best Adjusted Slope 90d values by setting the slider from 0% to 10% or by sorting the output column from high to low (to sort the column click on the column heading).
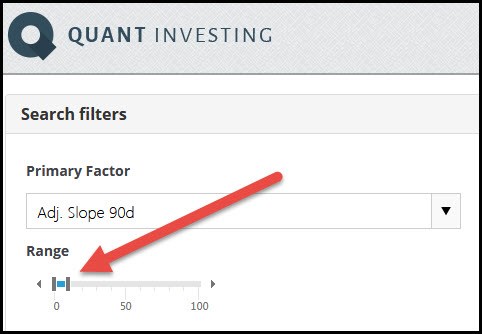
How to select the best Adjusted Slope 90d values
Click here to start using the Adjusted Slope 90 day indicator in your portfolio NOW!