

The Adjusted Slope 125/250d indicator is the average annualized exponential regression slope, over the past 125 and 250 trading days, multiplied by the coefficient of determination (R2).
It is thus the average of the 125 day and 250 day adjusted slope values.
Why an average of 125 and 250 days?
Why calculate the average you may be thinking.
This is to give you a longer term (6 months and one year) average adjusted slope value that smooths out large movements in stock prices (by using the average).
You can use this indicator to find stocks that are on a smooth upward trend over the past six months as well as the past year.
What it means in easy to understand English
In easy to understand English, the Adjusted Slope 125/250d shows you how much the share price of a stock has increased over the past year if you average the 125d and 250d adjusted slope values. AND this value is adjusted for how well the calculated increase matches the real increase in the stock price.
Where can you find it?
In the screener you can use the Adjusted Slope 125/250d indicator either as a primary factor or as a column in the results of your screen.
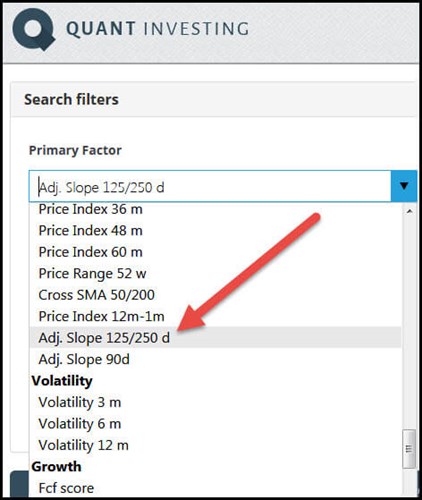
How to select Adjusted Slope 125/250d as a primary screening factor
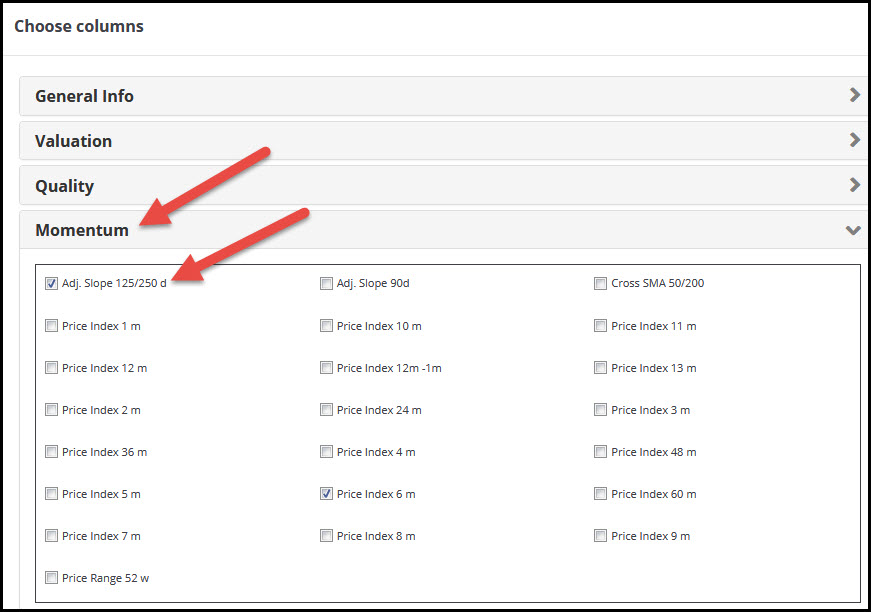
How to select Adjusted Slope 125/250d as an output column
What is good and what bad?
The higher the Adjusted Slope 125/250d value the better as it means the share price has increased a lot over the past 125 and 250 trading days and that the calculated increase closely fits the real increase in the stock price.
You can select the best Adjusted Slope 125/250d values by setting the slider from 0% to 10% or by sorting the output column from high to low (to sort the column click on the column heading).
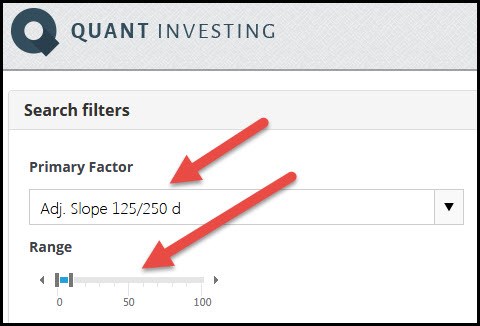
How to select best Adjusted Slope 125/250d values
More information about Adjusted Slope and how to use it
This easy to use adjusted slope momentum strategy performed 7 times better than the market
How to find stocks on the move with a better momentum indicator - exponential regression
Click here to start using the Adjusted Slope 125/250 indicator in your portfolio NOW!