

What investment strategy would have given you the best return in the first nine months of 2016.
Here is a short summary:
- Price to book worked VERY well +34.6% (who would have thought that)
- Quality did not work
- Momentum was a disaster
Before I show you the exact strategies and their returns first some information on what and how we tested.
What we tested – 7,000 companies worldwide
We looked at the performance of the following 17 investment strategies over the just over 10 month period from 1 January 2016 to 2 November 2016:
- Large vs small companies
- Book to Market value (inverse of price to book)
- Earnings yield (EBIT / EV)
- Qi Value ranking [add URL]
- Value Composite One rank
- Value Composite Two rank
- Shareholders Yield (Dividend yield + Percentage of Shares Repurchased)
- Dividend Yield
- Dividend growth 5 years (The geometric average dividend per share growth rate over the past 5 years)
- Qi Liquidity ranking (Adjusted Profits / Yearly trading value)
- Free Cash Flow (FCF) Score (Calculated by combining Free cash flow growth with free cash flow stability)
- Price Index 6m (Current share price / Share price 6 months ago)
- Price Index 12m (Current share price / Share price 12 months ago)
- ERP5 rank (Ranking based on Price to Book, Earnings Yield, Return on invested capital (ROIC), 5 year average ROIC)
- Magic Formula (MF) (Joel Greenblatt) ranking
- Piotroski F-Score
- Gross Margin Novy Marx (gross profits (sales minus cost of goods sold) / total assets (depreciation deducted))
Only companies worth more than $50 million
We excluded companies with a market value less than $50 million, to make sure that we only look at companies you can buy and sell easily.
Markets worldwide
We included markets worldwide because only when you look at markets worldwide can find the best companies that fit your investment strategy.
The following markets were included:
- USA
- Canada
- Eurozone countries
- United Kingdom
- Switzerland
- Norway
- Denmark
- Sweden
- Australia
- New Zealand
This gave us a list of about 7,000 companies.
All companies in five groups – Quintile 1 the best
For each of the strategies we divided all the companies into five groups (20%) or quintiles.
Quintile 1 shows the companies that scored best in for the strategy we tested and Quintile 5 the worse.
This, for example means that Quintile 1 shows the return of the 20% of companies with the highest book to market ratio (lowest price to book) at the start of the year. And Quintile 5 shows the return of companies with the lowest book to market ratio (highest price to book ratio).
For Price Index 6m quintile 1 show companies with the best momentum (biggest share price increase over 6 months) and quintile 5 companies with the biggest price fall in the previous 6 months.
For F Score quintile 1 shows the return of companies with the best Piotroski F-Score (9 or 8) and quintile 5 those with the worse F-Score.
For the Size strategy quintile 1 shows the return of the 20% of companies with the biggest market value and quintile 5 the 20% smallest companies.
What did not work?
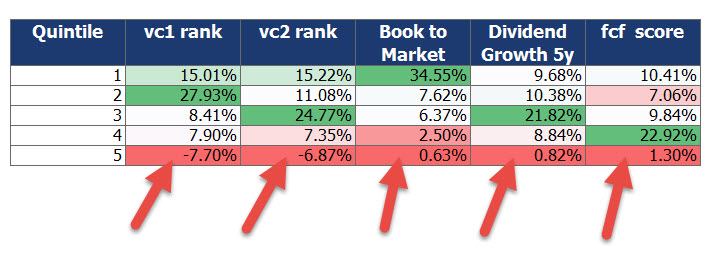
Let us first look at what strategies did not work so far this year.
Click image to enlarge
Source: www.quant-investing.com
The following strategies did not do well:
- Companies with a bad Value Composite 1 or 2 score
- Companies with a high price to book value (low book to market)
- Companies with low dividend growth over the past five years. Odd is that companies with the best dividend growth did not do very well.
- Companies with a bad F-Score. Unusual is that companies with a good F-Score (quintiles 1 and 2) did not do as well but those just a bit better than terrible did well.
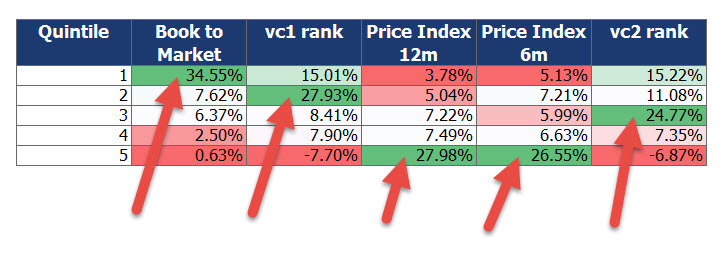
What worked?
Far more interesting of course is what strategies did do well.
Click image to enlarge
Source: www.quant-investing.com
This would have been your best strategies so far this year:
- Low price to book companies did VERY well
- James O’Shaughnessy’s Value Composite One and Two ranking
- Companies with bad momentum (declining share price) over the past 6 and 12 months did very well. Dead cat bounce companies perhaps…
Here are all the results
Here is the complete table of the return of all 17 strategies.

Click image to enlarge
Your crystal ball is better
Please remember just because a strategy did well so far this year does not mean it will continue to do so for the rest of the year.
I hate (and do not make forecasts) because I am very bad at it. You are probably a lot better at it than I am.
PS To get this report on a daily basis as well as the tools to implement them in your portfolio why not sign up now, it costs less than an inexpensive lunch for two, just click here: join now
PPS Why not sign up right now while its still fresh in your mind?
