

Last updated: May 2026
By Tim du Toit — 39+ years of quantitative investing experience, co-author of Quantitative Value Investing in Europe (2012).
Quality Value Momentum (QVM) strategy — definition:
A systematic multi-factor investment strategy that filters stocks in three sequential steps: (1) remove low-quality companies using FCF-to-debt, Gross Margin (Marx), and Accrual Ratio CF thresholds; (2) select the top 20% most undervalued companies by Earnings Yield (EBIT/EV); (3) apply a momentum filter using 3-month and 6-month Price Index, keeping only the top 50% by momentum. Final portfolio: 20 stocks ranked by Value Composite One. Back-tested return in Europe: +1,142% over 13 years (2001–2014) vs +57% for the STOXX 600 index.
Key findings from the QVM back test (Europe, 2001–2014):
- €10,000 invested in the QVM strategy grew to €114,180 over 13 years
- The same €10,000 in the STOXX 600 index grew to only €15,720
- QVM total return: +1,142% vs index return of +57%
- Strategy combines three independently proven factors: quality, value, and momentum
- Final portfolio holds 20 stocks, rebalanced when new ideas emerge
- Source: Quantitative Value Investing in Europe: What Works for Achieving Alpha (du Toit & Vanstraceele, 2012), with updates through August 2014
This Quality Value Momentum (QVM) investment strategy contains the best ideas from our research paper Quantitative Value Investing in Europe: What works for achieving alpha as well as all the research we have done since then.
How you can earn +1142% over 13 years
This article shows you the back tested results of the investment strategy over 13 years as well as exactly how to implement it in your portfolio as well as .
The strategy is a combination of quality, value and momentum, all the factors we have found that can give you the highest possible returns.
This is how the companies were selected:
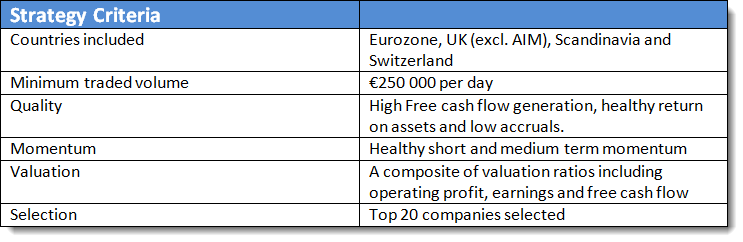
How are the companies selected?
Quality
The first thing we do is remove all the low quality companies from the list of possible investment ideas.
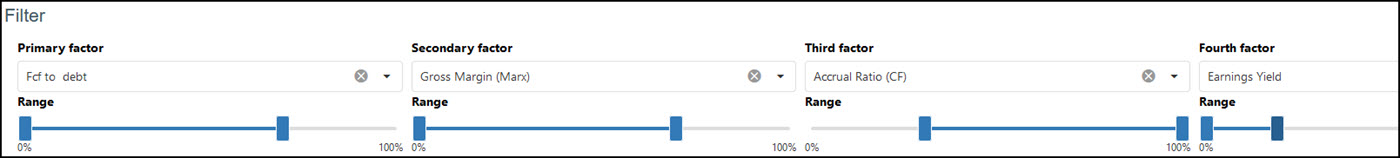
First remove companies that generate a low level of free cash flow to total debt (a company must generate cash to repay its debt). Use the FCF to debt ratio in one of the sliders in the screener and select 0% to 70%. This gets rid of the worst 30% of companies.
Secondly remove companies that have a low return on assets. Research has shown that companies with a low return on assets don't generate high returns. Use the ratio Gross Margin (Marx) and select 0% to 70% with the slider.
Thirdly remove companies where there's a big difference between the profits and the free cash flow the company generates. Again because research has shown that companies with free cash flow nearly equal to profits (low level of accruals) give you much higher returns. Use the ratio Accrual Ratio CF and select 30% to 100% with the slider.
Valuation
After removing all the low quality companies we select the top 20% of companies with the highest earnings yield (EBIT to enterprise value). Use the ratio Earnings Yield and select 0% to 20% with the slider.
Most of the time the simplest ideas lead to the best results, this is definitely true of this valuation ratio as numerous research studies have shown that this is the most effective valuation ratio you can use to look for high return investments.
This is what your screen should look like:
Momentum - Do this in Microsoft Excel
If there's one fact that came out of the above-mentioned research study it is that if you want high returns you must consider share price momentum.
To select investment ideas for the QVM strategy combine 3 month (Price Index 3m) and 6 months (Price Index 6m) share price momentum so that only companies with an upward moving share price are selected.
For both 3 and 6 month Price Index select the top 50% of companies with the top momentum.
To do this you must export the above results to Microsoft Excel.Click here to see how: How to export results from the Quant Investing stock screener
Inside Excel first activate the Filter function on the exported data. This article shows you how: How to Filter data in Excel
Once you have done that apply a filter to the 6m PI and 12m PI columns so you only get the top 50% - select "Above Average".
Best 20 ideas
After you have selected all the above-mentioned criteria, select the 20 most undervalued companies based on a Value Composite One rank as defined by James O'Shaughnessy in the fourth edition of his excellent book What Works on Wall Street.
To do this simply sort the Value Composite One column in Excel from low to high.
In summary a simple idea what works well
Even though this may seem really complicated the investment strategy boils down to the following simple principles:
- Remove bad quality companies
- Look for undervalued companies
- That have good share price momentum
- Choose only the most undervalued companies
Find quality, value and momentum stocks right now
The QVM strategy uses three screener ratios — FCF to Debt, Gross Margin (Marx), and Accrual Ratio CF — plus Earnings Yield and Price Index momentum. All of these are built into the Quant Investing screener. You can set up the full quality and valuation filters in minutes, export to Excel, and apply the momentum filter with a single sort.
Try the QVM screener free for 30 days
No credit card needed. Cancels automatically after 30 days.
How did the strategy perform?
| QVM Strategy Back Test | |
|---|---|
| Period | 29 June 2001 to 22 Augustus 2014 (13.16 years) |
| Rebalance Frequency | Every 6 months |
| Ranking System | Quality, Value, Momentum |
| Benchmark | European STOXX 600 Total Return Index (dividends included) |
| Number of positions | 20 |
| Rebalancing cost | 0.6% (deducted at each rebalancing to cover trading and bid ask spread costs) |
| Strategy Total return | 1141.8% |
| Strategy Compound annual growth rate (CAGR) | 21.1% |
| Benchmark Index return | 57.2% |
| Benchmark Compound annual growth rate (CAGR) | 3.5% |
| Benchmark outperformance total | 1084.6% |
| Benchmark outperformance annualised | 17.6% |
| Strategy maximum drawdown | -50.8% |
| Benchmark maximum drawdown | -58.4% |
| Strategy number of positive investments | 66.1% |
| Sharpe Ratio | 1.05 |
| Standard Deviation of returns | 20.2% (Weekly standard deviation annualised) |
Yearly performance
The table below shows the yearly returns of the QVM strategy compared to the European STOXX Total Return index (which includes dividends):
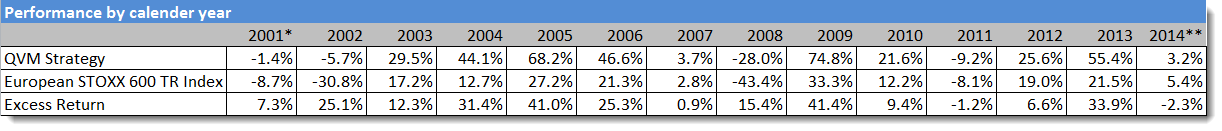
Click image to enlarge
(*) Inception date 29-06-2001
(**) End date 22-08-2014
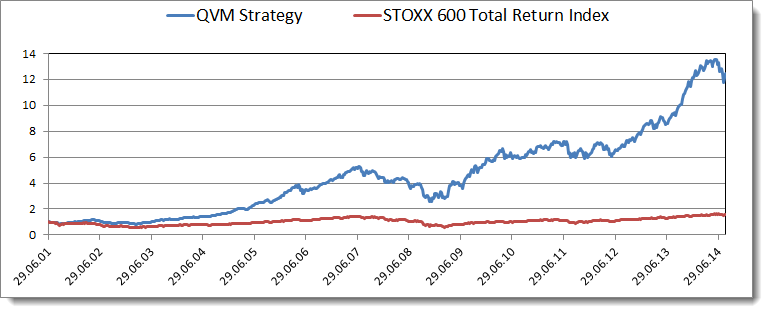
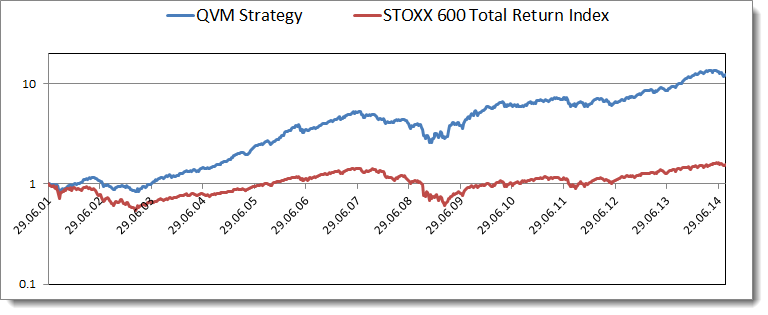
Growth of your investment in the strategy
This chart shows the growth of investing €1 in the QVM strategy compared to if you invested in the European STOXX 600 Index (dividends included).
€1 grew to €12 index only €1.57
As you can see in the chart below your €1 investment in the QVM Strategy would have grown to just less than €12.
Compare this to if you invested €1 in the index you would have only had €1.57 after 13 years.
Your €10 000 grew to €114 180
This means if you invested €10 000 in this investment strategy after just more than 13 years you would have had €114 180 in the bank.
If you invested the same €1 000 in the index you would have only had €1 572 after 13 years.
This is what your returns would have looked like:
Returns logarithmic scale
This chart below also shows your return of investing €1 in the QVM Strategy and the index but it shows a logarithmic scale to show that the index was even more volatile than the QVM Strategy.
Start screening for QVM investment ideas today
The back test shows what the QVM strategy can do over the long term. The free demo screener gives you access to 22,000+ companies across all the ratios used in this strategy — FCF to Debt, Gross Margin (Marx), Accrual Ratio CF, Earnings Yield, and Price Index momentum. The data is approximately one year old, which is ideal for testing and learning the strategy methodology before committing.
Screen for quality, value and momentum stocks
No credit card needed. Cancels automatically after 30 days.
Frequently asked questions about the QVM strategy
1. What does QVM stand for in investing?
QVM stands for Quality, Value, Momentum. It is a multi-factor stock selection strategy that combines three independently proven return factors into a single, systematic process. Stocks must pass quality filters first, then be selected for deep value, and finally filtered by upward price momentum.
2. What return did the QVM strategy produce in back testing?
In European markets from 29 June 2001 to 22 August 2014 (13 years), the QVM strategy returned +1,142%, growing €10,000 to €114,180. The STOXX 600 Total Return index returned +57% over the same period, growing €10,000 to €15,720. The strategy was back tested in the research paper Quantitative Value Investing in Europe: What Works for Achieving Alpha (du Toit & Vanstraceele, 2012).
3. What is the difference between QVM and the Magic Formula?
Joel Greenblatt's Magic Formula combines two factors: return on capital (quality) and earnings yield (value). The QVM strategy adds a third factor — share price momentum — using 3-month and 6-month Price Index. QVM also uses more granular quality filters (FCF to Debt, Gross Margin (Marx), Accrual Ratio CF) rather than a single return-on-capital measure. Research consistently shows that adding momentum to value strategies significantly increases returns.
4. How many stocks does the QVM strategy hold?
The final QVM portfolio holds 20 stocks. These are selected as the 20 most undervalued companies (lowest Value Composite One rank) after passing all quality and momentum filters across Europe's investable universe.
5. How often do you rebalance the QVM portfolio?
The strategy is not on a fixed rebalancing schedule. You rebalance when the screener identifies new stocks that rank better than your current holdings on the combined quality, value, and momentum criteria. In practice, this tends to result in partial portfolio turnover every 6–12 months.
6. Does the QVM strategy work outside Europe?
Yes. A separate back test on North American companies produced a return of +962% over the same 13-year period (growing $10,000 to $106,238 vs $26,899 for the Russell 2000 Total Return index). The same three-factor methodology applies; the screener ratios and selection process are identical.
