

Estimated Reading Time: 8 minutes
Want to know if your investment strategy is worth putting real money into? Then this post is for you. It shows you how to back-test your strategy using historical data, so you can see if it would have worked in the past.
You will see, step-by-step, how to test and refine your approach before risking real money. This guide is perfect if you're looking to invest smarter and with more confidence. It's practical, easy to follow, and gives you the tools you need to make better investment decisions.
Further Reading About Back Testing
Did you know the Quant Investing stock screener has got an extra feature that lets you back test your investment strategy with point-in-time data. This article shows you how you can easily back test your investment strategy to make sure it works.
What is Back Testing?
Back testing means you go back in time and see exactly what companies fit your investment strategy and how they have performed.
When you do this you are not using calculated back test ratios but actual values, ratios and indicators, as they were in the past (point in time data) you thus have no look-ahead or survivorship bias in your back test.
We got this data by saving the whole screener database every day. We have been doing this since 4 December 2015, which means you can back test since then.
How to Back Test Your Investment Strategy
This is how you can start using the historical point in time back test database.
We expand on all these points below but here are the steps if you already know the screener:
- Login and go to the screener
- Set up or load a saved stock screen
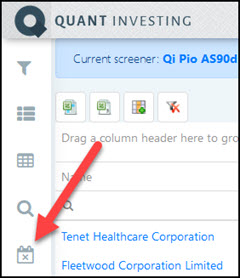
- Click on the Historical Screener icon
- Select the date in the past where you want the screener results for
- Select the future closing price date to where you want to calculate returns
- Click Confirm to get the historical screener results
Click here to start back testing NOW!
Here Are the Detailed Steps
Here are the detailed steps for you to back test your investment strategy using the back test point in time database.
1. Login and Set up or load a saved screen
For instructions on exactly how to log in and set up a screen look at this article: How to run your first screen with the Quant Investing screener
2. Get historical results of your screen
Once you have run your screen and you have a list of companies that currently fit the screen you are ready to go back in time.
To do this click on the Historical Screener icon to open the Historical Screener date selector.
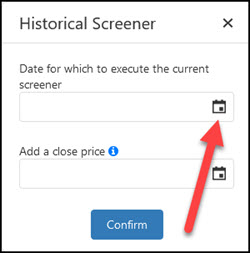
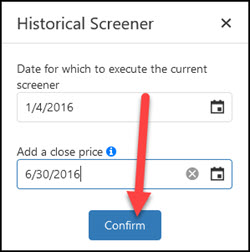
A window will the open where you can select two dates.
The first date is the date in the past you want to the screener to run and give you investment ideas. The closing stock prices on this date will automatically be loaded.
You can also (you do not have to) select a second closing price date. If you add a second date the Historical Screener will automatically calculate the stock price percentage change from the first screener date to the second closing price date.
For example , if you choose to run the historical screener on 3 January 2016 (first date) and enter 30 June 2016 as the second date the screener will automatically calculate the stock price return from 3 January 2016 to 30 June 2016 for you.
This makes it easy to see how your investment strategy has performed.
To select the first date you would like to screen for click the top date selector icon.
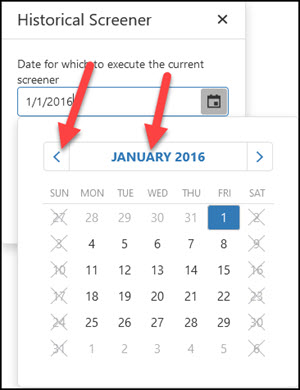
To select a date you can either click the blue left arrow or click on the date heading as shown below.
Next select a second closing stock price date.
The Historical Screener will calculate returns from the above selected screener date to this date.
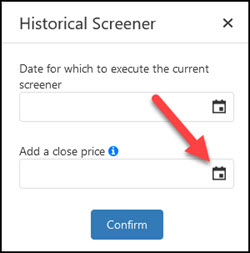
After selecting the date click the Confirm button to start the historical screen.
That is all you have to do to screen past results.
To test a lot of periods all you have to do is continue to select the periods you would like to back test for and export the results to Microsoft Excel, as explained below.
Click here to start back testing your investment strategy Now!
If there is "No Data"
As you saw you can only select weekdays. However it may happen that the day you selected was a market holiday with no closing price information.
If it was a market holiday you will see a "No data" message like this:
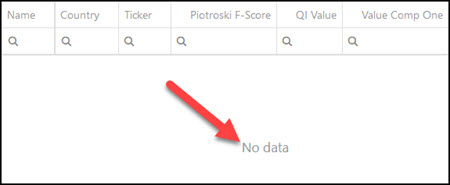
To solve this problem simply select a day before or after the date you selected.
What were the returns of your back test?
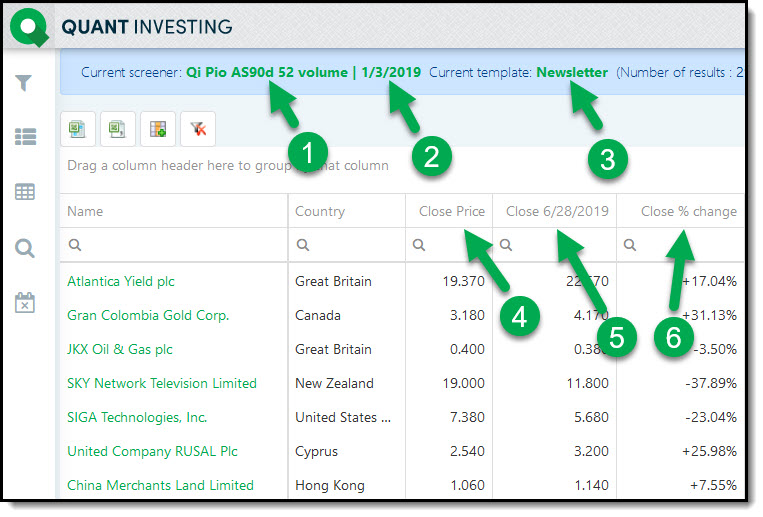
The results of your back test will look like this (see number explanation below):
Click image to enlarge
- Shows you the name of the saved screen you are back testing
- Shows you the date you are back testing (companies that fit your screen on this date)
- Shows you the saved Template you are using. A Template is a saved collection of columns displayed with a screen.
- The closing stock price on the date you are back testing. The date shown in 2.
- The second closing price you selected.
- The percentage change from the closing price in 2 to the closing price in 5.
If The Returns Look Unusual
Even though we do everything we can to give you the best quality data, with over 110 ratios on over 22,000 companies small problems can creep in. So, if the returns of companies in your back rest look unusual, -100%, or extremely high, or no return for example. It may happen when a company gets taken over, does a stock split or consolidation, or goes bankrupt.
To find the last price the company traded at simply do an internet search with its name. An article is sure to come up on what happened to the company. Depending on what you find simply adjust the price data or delete the company. You can easily do this by exporting the back test results to Microsoft Excel as explained below.
Click here to start back testing your investment strategy Now!
Export to Excel for More Calculations
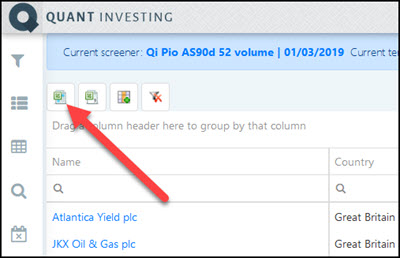
If you want to calculate more return numbers remember you can export the above results to Microsoft Excel.
To export to Excel just click on the Export Data to MS Excel icon.
Frequently Asked Questions
1. Why should I back-test my investment strategy?
Back-testing lets you see how your strategy would have performed in the past, helping you understand its potential and risks before you invest real money.
2. What is "point-in-time" data in back-testing?
Point-in-time data means using historical data as it was at that time, avoiding hindsight bias. This makes your back-test more accurate.
3. How do I start back-testing my strategy?
First, log in to the Quant Investing screener, set up your screen, click the Historical Screener icon and choose the dates you want to test.
4. Can I trust back-test results to predict future performance?
While back-tests offer insights, they can't guarantee future results since market conditions change.
5. What do I do if my back-test shows no data?
If you encounter "no data," it might be due to market holidays. Try selecting a different date close to your original choice.
6. How can I calculate returns between two dates?
The Historical Screener feature lets you select two dates, and it automatically calculates the stock price change between them.
7. Why do some back-test results look strange?
Odd results might happen if a company was taken over or went bankrupt. Research the company to understand the result better.
8. Can I export my back-test results?
Yes, you can export your back-test data to Excel for more detailed analysis and calculations.
9. How far back can I test my strategy?
The Quant Investing screener allows back-testing from December 2015 onwards.
10. Is back-testing difficult to set up?
No, it's very easy! Follow the steps in this article How to back test your investment strategy - Real world example, and you’ll be able to start testing in minutes.
PS Not a subscriber to the Quant Investing stock screener and back tester yet? Sign up here.
PPS Why not sign up right now before it slips your mind?
