

This article shows you how to increase your investment returns with the ERP5 strategy.
You will learn what the ERP5 strategy is, how it consistently beats the market and the Magic Formula, and how to easily find ERP5 investment ideas for your portfolio.
By focusing on four key financial ratios, ERP5 helps you find undervalued stocks with high return potential. You'll see back-tested results showing impressive performance and learn how to enhance returns further by combining ERP5 with other ratios like momentum.
Estimated Reading Time: 7 minutes
A strategy that beats the Magic Formula
The ERP5 investment strategy was developed by two friends, Philip Vanstraceele and Luc Allaeys when they set out to find an even better investment than the Magic Formula. As you know the Magic Formula was developed and tested in the excellent book by Joel Greenblatt called The Little Book that Still Beats the Market.
How is the ERP5 value calculated?
The strategy finds undervalued companies through the use of the following four ratios.
- Earning Yield (EBIT / Enterprise Value) – Profits before interest and taxes compared to enterprise value.
- Return on Invested Capital (EBIT / (Net Working Capital + Net Fixed Assets)) – The return a company generates on the capital invested in the business.
- Price to Book (Market value / Book value) – share price compared to the book value of the company
- 5-year average Return on Invested Capital – Five year average EBIT to Five year average ((Net working capital) + Net Fixed Assets)
They named the strategy ERP5, based on the first letter of the 4 ratios.
Best companies have the lowest ERP5 rank
To calculate the ERP5 ranking you simply rank each company against all the other companies based on all four ratios.
Once you have ranked all the companies you add the individual rankings, for each ratio, together to give you one combined ranking for each company. You then rank all the companies by this combined ranking.
In the screener we group this combined ranking into percentiles (from 1 to 100), with 1 is the 1% of companies with the best ERP5 rank and 100 the worse ranked.
The ERP5 rank of more than 22,000 companies is available in the Quant Investing stock screener.
All calculations done for you
Don’t worry if this looks intimidating, the Quant Investing stock screener does all these calculations for you. You can find all the ERP5 investment ideas with a few mouse clicks.
Click here to start using the ERP5 strategy in your portfolio NOW!
Does the ERP5 investment strategy work?
Now we come to the most important question. Does the ERP5 investment strategy work?
We tested ERP5 as an investment strategy in Europe over the 12 year period from June 1999 to June 2011.
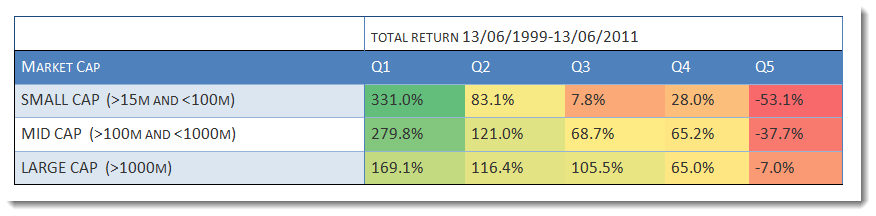
Source: Quantitative Value Investing in Europe: What works for achieving alpha
As you can see companies with the lowest ERP5 values (the most undervalued companies), quintile 1 or Q1 in the above table, did a lot better than companies with a high ERP5 value, and did this for small, medium and large companies.
Substantially better than the market
Low value ERP5 companies all also substantially outperformed the market which returned only 30.54% over the same 12 year period.
This is how the above back test was done.
The back test universe and benchmark
The back test universe was a part of companies in the Datastream database containing an average of about 1500 companies in the 17 country Eurozone market during our 12-year test period (13 June 1999 to 13 June 2011).
We excluded banks, insurance companies, investment funds, certain holdings companies, and REITS.
We included bankrupt companies to avoid any survivor bias. For bankrupt companies, or companies that were taken over returns were calculated using the last stock market price available before the company was delisted.
We excluded companies with an average 30-day trading volume of less than €10 000.
It was not a good time to invest in stocks
The test period was most certainly not a good time to be invested in stocks. The 12-year period included a stock market bubble (1999), two recessions (2001, 2008-2009) and two bear markets (2001-2003, 2007-2009).
Holding periods and quintile tests
Each year all the portfolios were formed on 16 June. We chose 16 June as most European companies have a December year-end and by this date all their previous year-end results would be available in the database.
The annual returns for our back test portfolios were calculated as the 12-month price change plus dividends received over the period. Returns were compounded on an annual basis.
This means each year the return of the portfolio (dividends included) would be reinvested (equally weighted) in the strategy the following year.
The portfolios were all constructed on an equal-weighted basis.
In order to test the effectiveness of a strategy, we divided our back test universe into five equal groups (quintiles). The 20% best ranked ERP5 of companies were put in the first quintile (Q1), the next in the second, and so on, with the 20 % of companies with the worst ERP5 ranking in the fifth quintile (Q5).
Does it beat the Magic Formula?
For the same 12 year period mentioned above we also tested the Magic Formula (applied to European companies), compared it to the ERP5 strategy and this is what we found:
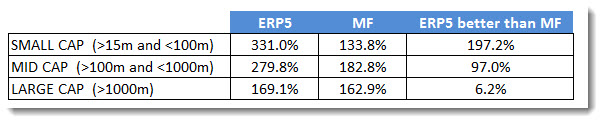
The table shows the total 12 year return of both strategies with the last column showing by how much the ERP5 strategy beat the Magic Formula.
Click here to start using the ERP5 strategy in your portfolio NOW!
ERP5 did substantially better +200%
As you can see the ERP5 strategy, for all size companies, did substantially better than the Magic Formula, in fact for small companies if you would have had done nearly 200% better.
Recent results
Here are more recent results of the returns you could have earned if you invested in the top 20% ERP5 companies world-wide.
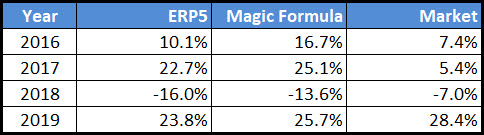
As you can see the ERP5 investment strategy did not beat the Magic Formula the last few years but both strategies substantially beat the market!
ERP5 performance in Europe
This is how the ERP5 investment strategy performed in Europe:
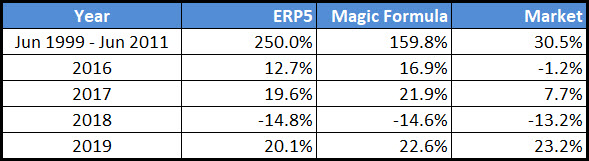
Also in Europe the recent performance was slightly worse than the Magic Formula but both strategies, overall continued to outperform the market.
How to improve the returns of the ERP5 strategy - a lot!
We also tested the ERP5 strategy with 13 other ratios and as you can see in the table below the returns of the strategy can be substantially improved.
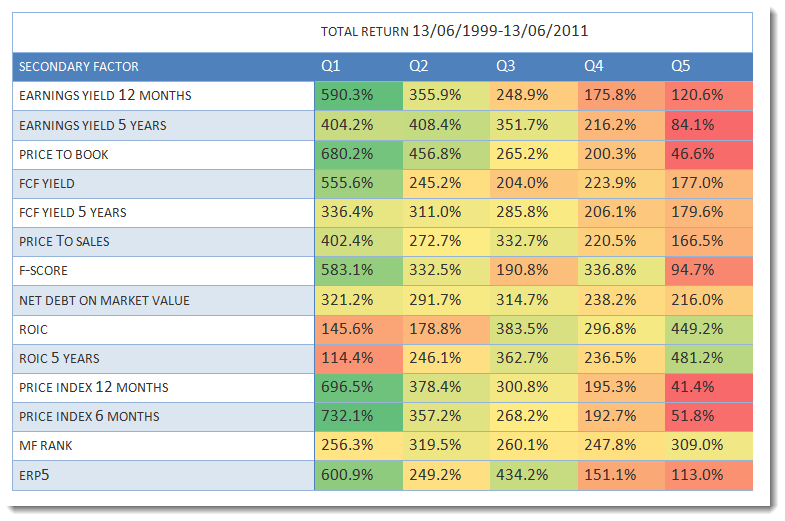
Source: Quantitative Value Investing in Europe: What works for achieving alpha
Look at column Q1
In the table the returns you should look at are those in column Q1. They show the returns generated by first selecting the 20% best ERP5 companies (most undervalued) and then sorting them by the items in the Secondary Factor column.
Best combination +732% was Momentum
This means you could have earned the highest return of 732.1% over 12 years if you invested in the best ranked ERP5 companies that also had the highest 6 month price index (stock price momentum).
Summary
As you can see the ERP5 investment strategy is something that deserves your attention because as a stand-alone strategy it has performed substantially better, not only than the market, but also better than the Magic Formula.
Click here to start using the ERP5 strategy in your portfolio NOW!
How to implement the ERP5 investment strategy in your portfolio
Because all the calculations are already done for you in the stock screener it is VERY easy to implement the ERP5 investment strategy in your portfolio.
The following is just an example; you can of course combine this strategy with any of the more than 110 ratios and indicators in the screener.
ERP5 momentum screen setup:
- As the Primary Factor or filter select the 20% of companies with highest ERP5 rank. To do this set the sliders from 0% to 20%.
- As a second factor select the 20% of companies with the highest Price Index 6m (six months price momentum). To do this set the sliders from 0% to 20%.
- Select the countries where you would like to invest by clicking on the drop down list below Countries.
- Set your Daily minimum trading volume - $125,000 in the image below.
- Select the minimum Market value of companies you would like to look for - $65m in the image below.
- Click on the Apply button to run your screen.
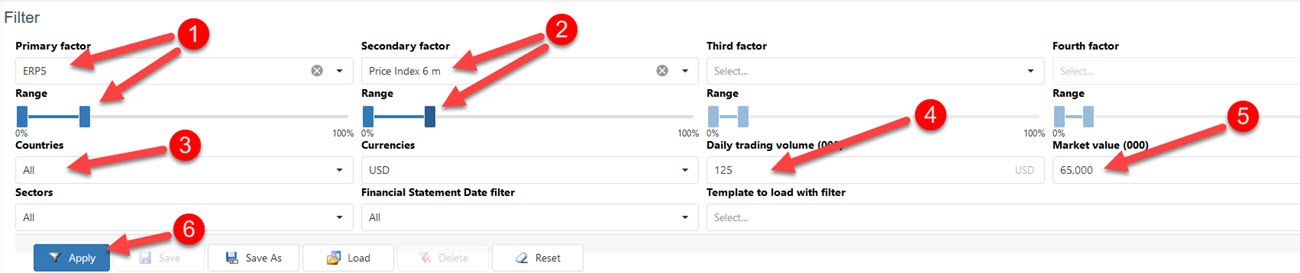
Click image to enlarge
In the results table click on the ERP5 Rank column heading once to sort the companies from low to high (the lower the ERP5 Rank the more undervalued the company is).
If the ERP5 column is not showing here is how you can add it: How to create and edit Templates in the Quant Investing stock screener
You now have a list of companies that fits the ERP5 momentum investment strategy.
Click here to start using ERP5 in your portfolio NOW!
How to keep your losses low
We strongly recommend that you use a strategy to keep losses low. You can read more about that here: Truths about stop-losses that nobody wants to believe
Exact definition of all ratios – the glossary
You can see the exact definition of all the ratios and indicators in the Quant Investing Glossary
Further reading about the ERP5 investment strategy
You can read more about the ERP5 investment strategy in the following articles:
A better alternative to the Magic Formula?
Does systematic value investing really work? – Data driven back test
Frequently Asked Questions (FAQs) For Investors Considering the ERP5 Investment Strategy
1. What is the ERP5 investment strategy?
The ERP5 strategy helps you find undervalued companies.
It uses four ratios:
- Earnings Yield,
- Return on Invested Capital,
- Price to Book, and
- 5-year average Return on Invested Capital.
These ratios measure how well a company is doing and how cheap its stock is.
2. Why should I use the ERP5 strategy instead of the Magic Formula?
The ERP5 strategy was created to beat the Magic Formula.
In tests, ERP5 often had higher returns. For example, it beat the Magic Formula by almost 200% for small companies over 12 years. This makes it a strong choice for finding undervalued stocks.
3. How has the ERP5 strategy performed in the past?
The ERP5 strategy has shown great results in back tests. From 1999 to 2011, it beat the market and other strategies. For example, the best ERP5 companies had a much higher return than the market, which only returned 30.54% in the same period.
4. How do I start using the ERP5 strategy in my portfolio?
It’s easy to start using the ERP5 strategy with the Quant Investing stock screener. You can load a saved screen for ERP5, customize it to your needs, and start finding great investment ideas with just a few clicks.
5. Can I improve the ERP5 strategy?
Yes, you can improve the ERP5 strategy by combining it with other factors.
For instance, adding a momentum factor (stocks with the highest price increase over six months) to ERP5 can boost your returns. This combo showed a 732% return over 12 years in back tests.
6. Is the ERP5 investment strategy good for all company sizes?
Yes, the ERP5 strategy works well for small, medium, and large companies.
In back tests it has consistently outperformed the market across all sizes. This makes it a versatile tool for your investment portfolio.
7. How can I minimize losses when using the ERP5 strategy?
To keep your losses low, we recommend that you use trailing stop losses. These automatically sell a stock if it drops below a certain price, thus they protect your investments from big losses.
Always have a plan to manage risks when investing.
Wishing you profitable ERP5 investing
PS To find ERP5 investment ideas in the countries where you invest (for less than an inexpensive lunch for two) click here: Sign me up right now!
PPS It is so easy to get distracted why not sign up right now before it slips your mind?
Click here to start using ERP5 in your portfolio NOW!
Please note: This website is not associated with Joel Greenblatt and MagicFormulaInvesting.com in any way. Neither Mr Greenblatt nor MagicFormulaInvesting.com has endorsed this website's investment advice, strategy, or products. Investment recommendations on this website are not chosen by Mr. Greenblatt, nor are they based on Mr Greenblatt's proprietary investment model, and are not chosen by MagicFormulaInvesting.com. Magic Formula® is a registered trademark of MagicFormulaInvesting.com, which has no connection to this website.
