

If you have found this article you have most likely heard of a falling knife investment strategy. In this article you can find out exactly why and how you can implement a falling knife investment strategy in your portfolio.
Forget winning stocks – buy losing companies
Why look for winning stocks if losing stocks give you higher returns over the long term.
That’s exactly what the research done by the Brandes Institute wanted to find out in a paper called “Falling Knives Around the World”.
They found that falling knife stocks outperformed the markets by 6.6% every year over a 24 year period.
What is a falling knife?
Exactly what is a falling knife stock you may be thinking?
Brandes defined a falling knife as a company whose stock price has fallen more than 60% in a 12-month period, over a year in other words.
Before I tell you how the strategy performed first some information on the company that did the research.
Who did the research?
Research was conducted by the Brandes Institute, the research division of Brandes Investment Partners.
As the authors explicitly state that the paper is not meant to promote or endorse any financial product, and is solely for informational purposes you can assume they did not have a conflict of interest as the paper was not used to sell any of their investment products.
Why did they do the research?
In an earlier paper, the authors found that falling knife stocks (stocks that declined 60% in a 12-month period) on U.S. stock exchanges beat the S&P 500 index.
In this paper, the authors used a longer back test period and included non-U.S. falling knife stocks in their investment universe.
They also wanted to find out if market capitalization and the enterprise-value-to-sales ratio had any predictive power in identifying falling knife stocks early on.
Now for information on the back test.
Time period tested
The back tested time period was over 24 years from 1980 to the end of 2003
What markets were included?
To identify U.S. falling knives, the authors used Computstat’s U.S. database, consisting of stocks listed on the NYSE, NASDAQ, NYSE American, and NYSE Arca.
For non-U.S. falling knives, the authors used Worldscope’s international database. They focused on the 22 countries that formed part of the MSCI World excluding the USA index.
This provides broad exposure to non-U.S. falling knife stocks from a variety of geographic locations.
Adjustments to universe – liquidity and excluded companies
The universe was constrained to only companies that had a $100 million post-fall (after losing more than 60% in a year) market capitalization or higher.
The last time companies were selected for the back test portfolio was at the end of December 2000.
Since the study ended at the end of December 2003, this gave the researchers three years to track the performance of the companies selected in December 2000.
Total universe after adjustments
Over the 24 test year period the researchers found 1,904 U.S. incorporated falling knife and 934 non-U.S. falling knife companies.
What market was used to compare results to?
The U.S. falling knives were compared against the returns of the S&P 500. The returns for non-U.S. falling knives was compared against the country’s MSCI index.
How the falling knife strategy was tested?
The researchers tested the strategy of buying global falling knife stocks.
These were defined as companies that declined by 60% or more within a 12-month time frame. The falling knife stocks were held for 3 years and then sold.
The paper did not clearly say when they scanned for falling knife companies and when they purchased. I am assuming it may be on a daily or monthly basis, but there is nothing to confirm this.
As the paper did not say anything about transaction costs I assume no transaction costs were included in the back test.
How many falling knife companies were found?
The portfolio size each year is not given, however, appendix A showed how many falling knife stocks were identified over two year periods.
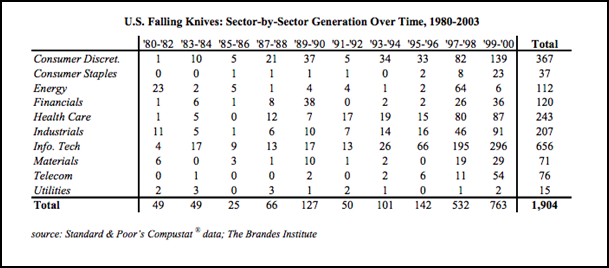
Source: Falling Knives Around the World
Click here to find your own Falling Knife investment ideas NOW!
Results and findings
Performance of US falling knives +11.2% yearly
Falling knife stocks in the U.S. posted an annualized 11.2% over 3 years, compared to the 4.6% return of the S&P 500. The average outperformance of U.S. falling knife stocks was 6.6%, but the median outperformance was -7.7%.
This shows you that most of the falling knife companies had negative returns, and only a few stocks performed so good that they were responsible for most off the returns.
Healthcare and utilities performed best
In the U.S., healthcare and utility falling knives produced the most outperformance.
Performance of non-US falling knives +10.8% yearly
Non-U.S. falling knives returned an average of 10.8% annually over 3 years, compared to the 5.3% return of the country’s MSCI index.
If you look at the median returns the same thing happened outside of the USA.
The median non-U.S. falling knife stock underperformed its country’s MSCI index by 3%, but the average outperformance was 5.5%, indicating a heavily right skewed distribution of returns - a few high return companies.
Energy and utilities performed best
Internationally, energy and utility falling knives produced the highest returns.
Smaller companies performed better
Internationally, falling knives with a post-fall market cap between $100 million and $1 billion outperformed their benchmark by 7.4% per year. Foreign falling knives with a post-fall market cap of over $1 billion only outperformed their benchmark by 2.0% per year.
Higher volatility and being undervalued helps returns
For both U.S. and non-U.S. stocks, falling knives that are generated in years of increased volatility (as measured by the rolling 12-month standard deviation of the S&P 500’s daily returns) tended to perform better than falling knives that were produced in less volatile years.
For both U.S. and international falling knives, those in the lowest quartile of enterprise value to sales posted the largest returns (11.6% outperformance for U.S. stocks and 12.9% outperformance for international stocks).
Enterprise value to sales is a measure of how undervalued the company is. The lower the value the more undervalued the company is. I assume the researchers used this ratio (with sales and not profits) as a lot of the companies were loss making.
The average EV/Sales ratio for the most undervalued 25% of companies was 0.8.
In the international markets, the falling knives in the highest quartile of enterprise value to sales (expensive companies) actually underperformed their benchmark by 0.5%
What can this investment strategy do for you?
If you are looking for an investment strategy to identifying a large number of stocks that will outperform the markets a falling knife strategy is not what you are looking for.
In fact, over half of both U.S. and international falling knife stocks underperformed their respective benchmarks.
What the strategy will do for you if help you find stocks that will significantly outperform the benchmark and make up for the dismal returns of other falling knife stocks.
What industry sectors performed best?
The healthcare sector posted the biggest outperformance over 3 years: 13.2% annually.
Utilities also posted an impressive 11.2% annual outperformance. The added advantage of the utility sector was that NO utility falling knives declared bankruptcy over the entire 23 year backtest period.
The only sector out of the 10 the authors analysed that underperformed the market on average after 3 years was the telecom industry. On average, falling knives in the telecom industry underperformed their benchmark by 10.11% annually.
All the falling knife stocks in the United States investment universe posted an average annual outperformance of 7.1% if the stocks were held for 3 years. Removing the information technology falling knives that were created during the dotcom bubble of the early 2000’s led to a 14.1% annual outperformance.
Bankruptcy rates higher in the USA
The bankruptcy rate of stocks in international markets (1.7%) is far lower than the bankruptcy rate in the United States (8.7%).
The authors attribute this to the fact that bankruptcy in the U.S. emphasizes reorganizing the capital structure of the business and strengthening the company once it emerges from bankruptcy.
In other countries, bankruptcy focuses on the immediate liquidation of the company’s assets and a reimbursement of creditors. This could discourage companies in distress from seeking bankruptcy as a mean to revitalize their business.
Summary and conclusion
As you have seen the majority of the stocks selected through this strategy performed worse than the market. However a few falling knives increased so much that they more than made up for the bad performing stocks and allow this strategy to substantially beat the market, both in the USA and worldwide.
But this is true for a LOT of investment strategies!
Now let’s move on to how you can implement a falling knife investment strategy in your portfolio.
Click here to find your own Falling Knife investment ideas NOW!
How to implement a falling knife investment strategy in your portfolio
This part shows you step-by-step how to implement a falling knife investment strategy using the Quant Investing stock screener.
This is what you want to screen for:
- Companies both in the U.S. and internationally that have declined by 60% or more in a 12 month time frame
- In the U.S., healthcare and utility falling knives produced the most outperformance
- Internationally, energy and utility falling knives produced the most returns
- Internationally, look for falling knife stocks with a post-fall market cap between $100 million - $1 billion
- Look for undervalued companies based on a low enterprise-value-to-sales ratio or other valuation ratio
What to avoid?
- Historically, falling knives in the telecom sector have considerably underperformed relative to their benchmark – this was related to the internet bubble so avoid any industry that may be in bubble territory
- Avoid expensive falling knife companies with a high enterprise-value-to-sales ratio or other valuation ratio
How implement the findings using the screener
Screening for falling knife companies is very easy because you basically just need one filter, companies that have fallen in price my more than 60%.
Step 1 – Select big price fall companies
To start your search you want to limit the number of companies the screener comes up with to only companies with a large fall in price.
To do this:
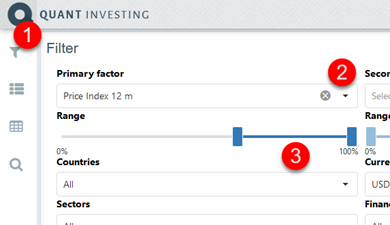
- Click on the Funnel icon
- Click the drop down arrow in the box below Primary Factor
- Select Price Index 12m from the menu that opens
- Set the sliders from 60% to 100% - this will give you only companies with a big fall in stock price
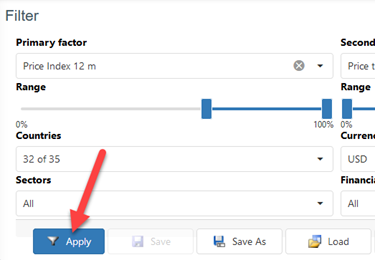
Step 2 – Choose countries and set minimum market value
Then you need to select what countries you want include in your search.
Next – as in the above research paper - you want to only look at companies with a market value above $100 million.
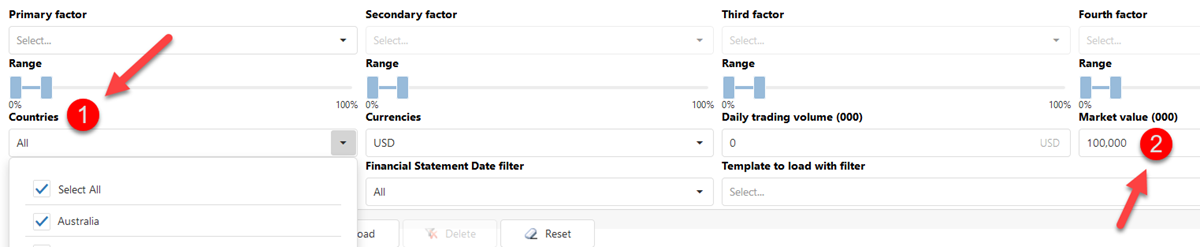
Click image to enlarge
Step 3 - Add Price Index 12m as an output column
To do this click the Add/remove columns icon shown below:
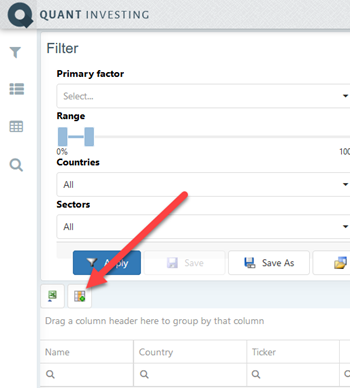
Then under the heading Momentum tick the box next to Price Index 12 m.
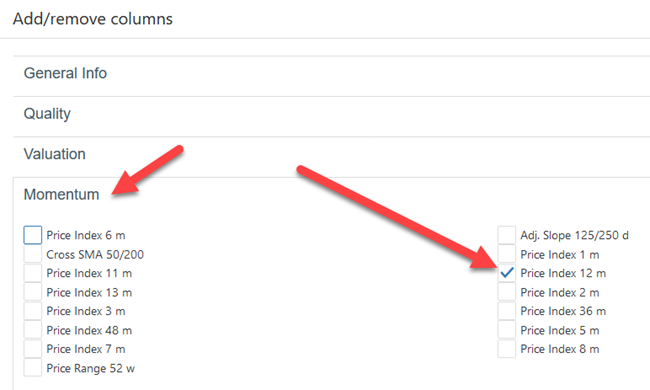
The Price Index 12m ratio takes the current share price and divides it by the share price 12 months ago. This is exactly what you need to find companies which had a stock price fall of more than 60% over the past year.
To do this you need to find companies with a Price Index 12m ratio of less than 0.4 ( 4/10 = 0.4 and is exactly a 60% price fall).
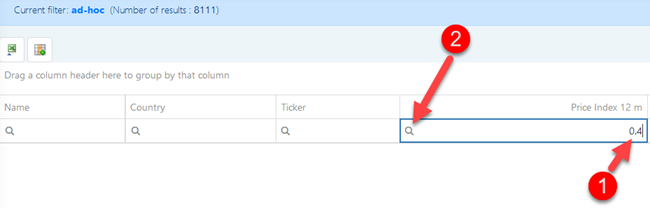
Step 4 – Find companies with a price fall of more than 60%
To do this enter 0.4 into the box below the Price Index 12m column.
You do this to find companies that’s share price has declined by more than 60% over the past 12 months.
Click here to find your own Falling Knife investment ideas NOW!
Step 5 – Optional - Select industries with the highest performing falling knife stocks
You can use the industry selector to select only the industries that had the best performance over the back test period.
These were:
- USA - healthcare and utility
- Non-USA - energy and utility
But be careful if you do this because just because these sectors performed best over the back test period does not mean they will do so in future.
Also if you only select a few industries you may not find enough companies to build a diversified portfolio of companies – ideally more than 30.
To select only certain sectors click on the drop down arrow in the box below Sectors. Tick the boxes next to the Sectors you want to select.
Step 6 – Choose only undervalued companies
In the study, the authors used the Enterprise-value-to-sales ratio, which is a measure of how undervalued a company is.
The screener does not have the Enterprise value to sales ratio but it does have the Price to sales ratio which is very similar.
It can also help you find the undervalued companies that did well very well in the research paper.
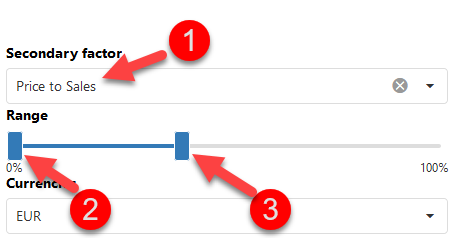
Since undervalued companies were found to give higher returns, we filter for the 50% of companies with the lowest Price-to-sales ratio.
To do this Select the Price to Sales ratio as Secondary factor to screen for. To select undervalued companies set the slider from 0% to 40%.
Step 6 - Use the Piotroski F-Score to choose only healthy companies
Although the authors did not test any ratios to improve the quality of the companies they selected you can do this easily by including the Piotroski F-Score in your screen.
This post is already too long so I will not include the reasons why you should use the Piotroski F-Score here but you can read all about it in the following articles:
Can the Piotroski F-Score also improve your investment strategy?
This academic can help you make better investment decisions – Piotroski F-Score
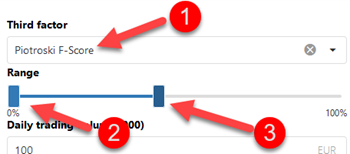
Including the F-Score in your screen is very easy. Simply select it as Third Factor and set the slider from 0% to 40% to select companies with an F-Score from 6 to 9 (9 is the best ranked company)
Step 7 – Run the screen
Now that we have our filters all set up all you have to do is to click the Apply button to run your screen.
Wishing you profitable investing
PS To get a falling knife investment strategy working in your portfolio right away sign up here
PPS It is so easy to put things off why not sign up right now?
Click here to find your own Falling Knife investment ideas NOW!
