

Last reviewed: June 2026
Discover how stop-loss strategies can protect your investments and increase your returns.
This article reviews four research studies showing that stop-loss and systematic selling rules, especially trailing ones, help limit losses and increase returns.
You'll learn the best stop-loss percentages to use, how they work, and practical steps to implement them in your portfolio. Whether you prefer a simple or trailing stop-loss, this strategy can help you manage risks and make better decisions.
Read on to see how stop-losses can transform your investing approach and protect your capital.
Estimated Reading Time: 8 minutes
Further Reading:
How to lower your losses and increase returns - Stop loss orders
How to implement the trailing stop loss rule
Navigating Market Storms: Taming Investment Volatility
How to add a Trailing Stop Loss to any stock - Get email alert
These ideas on how to sell increase profits and lower losses
I never used stop-loss orders, mainly because some limited testing I did found that a stop-loss strategy lead to lower returns even though it did reduce large losses.
But you know here at Quant Investing we look at investment research all the time and I found four interesting papers on stop-loss and systematic selling rules, with results that changed my view completely.
But before we get to HOW and WHAT stop loss you can use to increase your returns first the reason why you must keep losses low.
Why It Is Important to Keep Losses Low
In my over 39 years of investing experience, I noticed people often lose their ability to think clearly when they face big losses. I am sure you have also experienced this.
Your careful analytical judgement disappears.
The confidence (perhaps too much) you had when markets were going up turns to fear when headlines are scary, and you and your friends are losing money.
I learned that my judgement gets cloudy and far too negative in tough times. But I have seen that if I keep my thinking clear (with a system) and my money available, the rare periods of market panic create special opportunities, like in 2008 when everything got cheap.
If you have the emotional strength and cash to buy during these times, you can make big games gains. That is when we started the special Market Crash portfolios for newsletter subscribers, both of which posted great returns.
This means if you avoid large losses, your capital works like a ratchet. You make money, keep it, then make more, an upward spiral.
That is why it is never a good idea to compare yourself strictly to benchmarks. Obviously, you need to make a return on the money you invest yourself. But the great thing if you don't chase benchmarks is you don't have to ride them all the way down.
Research study 1 - When Do Stop-Loss Rules Stop Losses?
The first research paper When Do Stop-Loss Rules Stop Losses? and was published in May 2008 by Kathryn M. Kaminski and Andrew W. Lo.
The paper looked at the application of a simple stop-loss strategy applied to an arbitrary portfolio strategy (for example buying the index) in the US over the 54 year period from January 1950 to December 2004.
How was the stop loss applied?
The strategy used a simple 10% stop loss rule. When a 10% loss was exceeded the portfolio was sold and invested in long term US government bonds.
Cash would be moved back into the stock market once the 10% fall in the stock market was recovered (the 10% stop-loss was recovered).
What they found it worked very well
The researchers found that when the model was invested in the stock market it gave higher return than bonds 70% of the time, and during stopped-out periods (when the model was invested in bonds), the stock market provided a higher return only 30% of the time.
So it worked!
Over the whole 54 year period the study found that this simple stop-loss strategy provided higher returns while at the same time limiting losses substantially.
They also found that the stop-out periods were relatively evenly spread over the 54 year period they tested. This shows you that the stop-loss was not just triggered by a small number of large market movements (crashes).
If the researchers excluded the technology bubble (used data from Jan 1950 to Dec 1999) the model worked even better. This was because it got back into the stock market too quickly after the technology bubble crash.
This was most likely because the stop loss level was set too low. For a better stop loss level look at the next research studies.
Research study 2 – Performance of stop-loss rules vs. buy and hold strategy
The second research paper was called Performance of stop-loss rules vs. buy and hold strategy, published in 2009 by Bergsveinn Snorrason and Garib Yusupov.
What they tested
They compared the performance of following a trailing and normal stop-loss strategy to a buy and hold strategy on companies in the OMX Stockholm 30 Index over the 11 year period between January 1998 and April 2009.
This is a short test period but it included the bursting of the internet and the financial crisis.
Investments were made on the first trading day of every quarter (starting January 1998). When a stop-loss limit was reached, the stocks were sold and cash was held until the next quarter when it was reinvested.
What is really helpful is they tested stop-loss levels from 5% to 55%.
Trailing stop-loss results
The table below shows the results of the use of a trailing stop-loss strategy.
As you can see the highest average quarterly return (Mean = 1.71%) was obtained with a 20% trailing stop-loss level limit. The highest cumulative return (Cumulative = 73.91%) was achieved with a 15% trailing stop-loss limit.
The only stop-loss level that did worse than the buy-and-hold (B-H) portfolio, with a negative average return of 0.12% and cumulative return of -8.14%, was from a trailing stop-loss strategy with 5% loss limit.
Returns from using a trailing stop-loss strategy

Click image to enlarge
The following chart shows the total end value of all the strategies.
Trailing Stop-loss, equally-weighted total portfolio performance
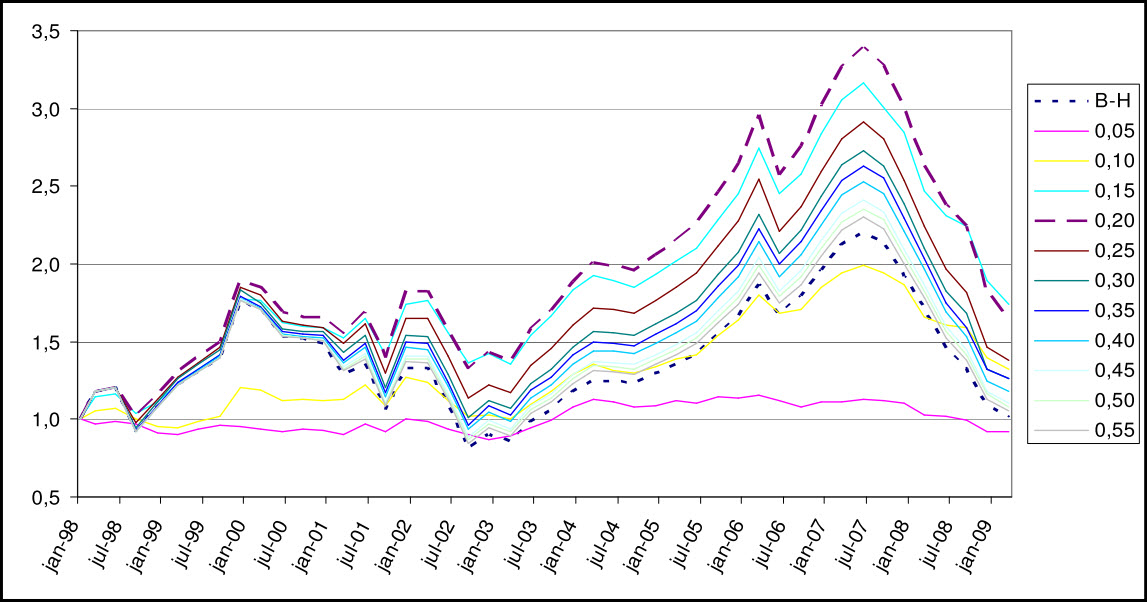
Click image to enlarge
As you can see the 15% and 20% trailing stop loss levels give you about the same overall result with the 20% stop-loss level leading to higher returns most of the time.
Traditional stop-loss strategy - not trailing
The following table shows you the results if you applied a traditional stop-loss strategy, which means that you would calculate the stop-loss from the purchase price.
Returns from using a traditional stop-loss strategy

Click image to enlarge
Surprisingly, all traditional stop-loss levels from 5% to 55% would have also given you better returns than the buy and hold (B-H) strategy.
The highest average quarterly return (Mean = 1.47%) was achieved at the 15% stop loss level and the highest cumulative results of 57.1% at the 10% stop-loss level closely followed by the 15% stop-loss level at 53.31%.
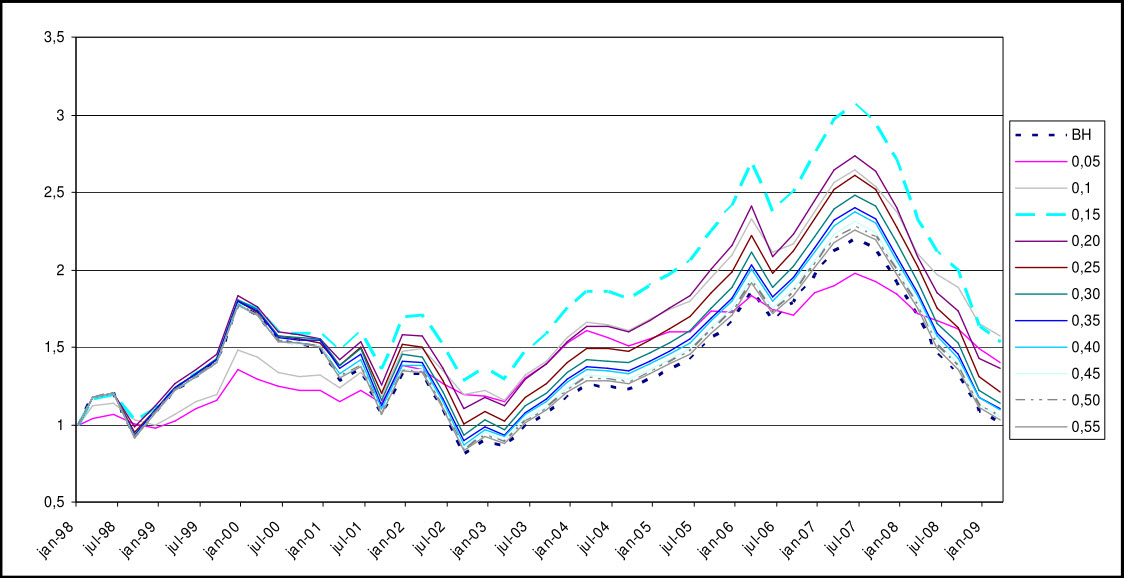
The chart below shows you the results of the traditional stop-loss strategy for all tested stop-loss levels.
Traditional Stop-loss, equally-weighted total portfolio performance
Click image to enlarge
In the chart you can see that the 15% loss level would have given you the best result over the largest part of the 11 year test period.
What is the best stop loss strategy?
So what is the better stop-loss strategy?
To find out we deducted the results of the traditional stop-loss strategy from the trailing stop-loss strategy.
The results are summarised in the following table:
Trailing stop-loss minus Traditional stop-loss

Click image to enlarge
Trailing stop loss is LOT better
Only at the 5% and 10% stop loss levels did the traditional stop-loss perform better than the trailing stop-loss BUT the overall returns were bad.
At all other loss levels the trailing stop loss outperformed, most notably at the 20% stop loss level where it performed 27.47% better over the 11 year period.
How to track your stop losses automatically - without watching prices every day
The research shows a 15% to 20% trailing stop loss significantly improves returns. The hard part is monitoring it across every stock in your portfolio.
The Quant Investing screener lets you add any stop loss level — normal or trailing — to each stock in your watchlist. When any stock breaches your stop loss, you get an automatic email alert. No manual price checking. No spreadsheets. Just an email telling you exactly which position to act on.
Try it free for 30 days. Includes the screener, watchlist with stop loss alerts, a 74-page eBook What Works on European Markets, and our Best Ideas Newsletter. No credit card. Cancels automatically after 30 days.
Set up automatic stop loss alerts — free for 30 days
No credit card needed. Cancels automatically after 30 days.
Research study 3 - Taming Momentum Crashes: A Simple Stop-loss Strategy
The third research study is called Taming Momentum Crashes: A Simple Stop-loss Strategy by Yufeng Han (University of Colorado), Guofu Zhou (Washington University) and Yingzi Zhu (Tsinghua University) and was published in August 2014.
What they tested
The researchers applied a simple momentum strategy of each month buying the 10% of companies with the largest price increase over the past six months and selling short the 10% of companies with the largest price falls the past six months.
Once the stop-loss was triggered on any day the company was either sold (Winners) or bought (Losers) to close the position. Remember this was a long-short portfolio.
If a position was closed the proceeds were invested in the risk-free asset (T-bills) until the end of the month.
Tested over 85 years
They applied this strategy over the 85 year period from January 1926 to December 2011 on all US domestic companies listed on the NYSE, AMEX, and NASDAQ stock markets (excluding closed-end funds and real estate investment trusts).
A lot lower losses
At a stop-loss level of 10%, they found that the monthly losses of an equal weighted momentum strategy went down substantially from −49.79% to −11.34%.
For the value-weighted (by the last month-end market value) momentum strategy, the losses were reduced from −65.34% to −23.69% (to -14.85% if August 1932 is excluded).
And Higher Returns
Not only did the use of the simple stop loss strategy reduce losses it also increased returns.
The stop-loss strategy increased the average return of the momentum strategy from 1.01% per month to 1.73% per month (a 71.3% increase), and reduced the standard deviation of returns from 6.07% per month to 4.67% (23% reduction).
It also increased the Sharpe ratio (measure of risk adjusted return) of the stop-loss momentum strategy to 0.371, more than double the level of the original momentum strategy of 0.166.
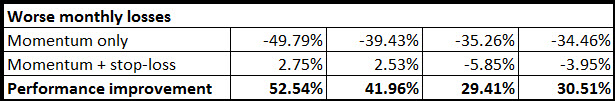
Helps you avoid market crashes
The stop-loss momentum strategy also completely avoided the crash risks of the original momentum strategy as the following table clearly shows.
Click image to enlarge
Note that if you followed a stop loss strategy you would have made a small profit when the momentum only strategy lost nearly 50% and 40%.
Research study 4 - A Century of Asset Allocation Crash Risk
The newest study in this article is also the one with the longest history. A Century of Asset Allocation Crash Risk was written by Mikhail Samonov (Two Centuries Investments) and Nonna Sorokina (Pennsylvania State University) and published in February 2023.
The two researchers rebuilt seven common ways of splitting a portfolio and ran each one back to 1926. That is a full century of returns through the Great Depression, the Second World War, the 1970s crash, Black Monday in 1987, and the 2008 to 2009 financial crisis.
This one is not a price stop-loss on single shares. I am including it because one of the seven strategies works like a stop-loss for a whole portfolio, and it gives the cleanest evidence I have seen for why a selling rule matters.
The rule, step by step
The authors called it the Dynamic strategy. It only ever holds two things: United States shares and United States bonds. Once a month it checks two numbers, the share trend over the past 11 months and how jumpy the shares have been, and then it sets the split between the two. Here is exactly what it did.
• If the shares had risen over the past 11 months and had been calm, the rule put more money into shares, up to 100%.
• If the shares had fallen, or barely moved, over the past 11 months, the rule cut shares and moved that money into bonds, down to 0% shares.
• If the shares had turned jumpy lately, with bigger swings than before, the rule trimmed shares even when the trend was still up, to keep the whole portfolio's swings near the level of a normal 60/40.
• It never sold short and it never borrowed. Each of the two holdings could sit anywhere from 0% to 100%, and the two always added up to 100%.
• It re-checked once a month and did nothing in between.
The exact split each month came from a simple risk and return calculation (a Markowitz mean-variance optimisation). It used each asset's past 11-month return as the expected return, and 5 years of price history to measure how risky each one was and how the two moved together.
It did not forecast and it does not take a view. It follows the trend and the volatility, once a month. Think of it as a trailing stop applied to a whole portfolio instead of one share at a time. A falling trend and rising volatility push money out of shares, the same way a trailing stop pushes you out of a single share that keeps dropping.
What it did to the losses
Over the century, the classic 60/40 portfolio (60% shares, 40% bonds) fell 62% from its peak at the worst point, and took close to 7 years to climb back to where it started. A fall of 15% or more happened more than 10 times. Risk Parity and the Endowment style were no better, close to 62% at their worst.
The Dynamic trend rule sat somewhere else completely.
| Strategy | Worst fall from peak, 1926 to 2020 | Falls of 15% or more |
|---|---|---|
| Classic 60/40 (60% shares, 40% bonds) | 62% | more than 10 |
| Factor-Based | 44% | few |
| Dynamic trend rule (shares and bonds, monthly) | 26% | 8 (only 2 above 25%) |
A worst loss of 26% against 62%. That is the difference between a setback you can sit through and one that makes you sell at the bottom.
What makes this research different and how this helps you
Here is what makes this paper different from the first three. The authors did not stop at the returns. They modelled what real investors do when the losses arrive.
Investors who had studied, or lived through, the deep history tended to stay in their seats. Investors who only knew the last 10 years panicked and sold near the lows. The gap in their results is large.
Take a 60/40 investor who started in 1971. The one who held through every crash ended with a cumulative 3,651.97%. The one who got scared and sold in February 2009, near the bottom, ended with 2,398.57%. Still good, but a long way behind. The investors who only knew the last 10 years and sold out in 1974 ended with between 11.48% and a loss of 4.24%, against the 9.5% a year they would have earned by holding on.
Same market. Same starting point. The only difference was whether they could stay invested.
That is the case for a selling rule in one example. A rule that keeps your worst loss near 26% instead of 62% does something more valuable than save you 36% on paper. It keeps you invested long enough to earn the long-run return at all. Most investors who lose money in a crash do it by selling during the crash. That makes a mechanical rule that takes that decision out of your hands at the moment your judgement is worst very valuable.
Do you hate price driven stop loss strategies?
Do you hate a price driven stop-loss system? If so you are most likely a hard core value investor.
Here is something you may want to consider, a fundamental stop loss suggested by a friend and long-term subscriber to the Quant Investing stock screener.
You can read the whole article here:
Ever thought of using a fundamental stop-loss?
Summary and Conclusion - Stop-loss strategies work
This has been a long article to show you that stop-loss strategies work
As you have seen:
- When applied to a 54 year period a simple stop-loss strategy provided higher returns while at the same time lowering losses substantially
- A trailing stop loss is better than a traditional (loss from purchase price) stop-loss strategy
- The best trailing stop-loss percentage to use is either 15% or 20%
- If you use a pure momentum strategy a stop loss strategy can help you to completely avoid market crashes, and even earn you a small profit while the market loses 50%
- When tested over a full century (1926 to 2020), a simple monthly trend rule that switched between shares and bonds cut the worst portfolio loss from 62% to 26%, and the investors who used a rule like this were far more likely to stay invested and earn the long-run return.
- Stop-loss strategies lowers wild down movements in the value of your portfolio, substantially increasing your risk adjusted returns
The Difficult Part - Your Emotions
The key to making a stop-loss strategy work is to stick to your plan, not once but over and over and over again.
The difficult part is to not let your emotion keep you from selling when a stop-loss level is reached.
Put the research to work - Track your stop losses automatically
Four independent research studies covering up to a century of data, point the same way: a mechanical selling rule, and a 15% to 20% trailing stop in particular, reduces your worst losses and helps you earn more over time.
The Quant Investing screener makes this practical. Add each stock in your portfolio to a watchlist, set your stop loss level for each position - normal or trailing - and the screener monitors it for you. When a stop loss is breached you get an email alert automatically, so you always know when to act.
Free for 30 days. Includes the full screener, watchlist with email stop loss alerts, What Works on European Markets (74 pages), and our Best Ideas Newsletter. No credit card required.
Automate your stop loss tracking — 30-day free trial
No credit card needed. Cancels automatically after 30 days.
How to Implement Your Stop-Loss Strategy
This is how you can implement a stop-loss strategy in your portfolio, it is also the stop loss strategy we use in the Quant Value investment newsletter.
- Implement a trailing stop-loss strategy where you calculate the losses from the maximum price the company has reached since you bought it
- Only look to see if the stop-loss has been exceeded on a monthly basis. If you look at it daily you will trade too much and the costs will lower your returns
- Remember to include dividends. When a company goes ex dividend (trades without the dividend) its stock price drops by the amount of the dividend so you have to add the dividend to the current stock price, here is the formula: (Current stock price - the highest stock price + the dividend per share) / the highest stock price.
- Sell your investment if at the monthly evaluation date the trailing stop-loss level of 20% has been exceeded
- Measure the trailing stop-loss in the currency of the company’s primary listing. This means measure the stop-loss of a Swiss company in Swiss Francs (CHF) even if your portfolio currency is Euros or US Dollars
- Reinvest the cash from the sale in the best idea that currently fits with your investment strategy. If you subscribe to the newsletter you would invest in the ideas you receive the month the investment is sold
It Will Not Always Work
These studies all showed the success of a stop-loss strategy over long periods of time, this of course does not mean that a buy and hold strategy will not sometimes outperform your stop-loss strategy.
But over the long term it will reduce your portfolio’s volatility (large losses) and increase your compound investment returns. This will also help you stick to your investment strategy!
System that sells your losers to invest in your best ideas
What a stop loss strategy also does is it gives you a disciplined system to sell losing investments, let your winners run, and invest the proceeds in your current best ideas.
Frequently Asked Questions About Stop Losses
1. What is a stop-loss strategy, and why should I consider using it?
A stop-loss strategy is a method used in investing to limit losses on an investment. By setting a predefined point at which your investment will be sold (stop loss order), you can prevent significant financial loss. Research shows that employing a simple stop-loss strategy can enhance returns while simultaneously reducing losses, making it an effective tool for managing risk in your portfolio.
2. What does the research say about the effectiveness of stop-loss strategies?
Multiple studies have shown that stop-loss strategies can be beneficial. For instance, one study demonstrated that over a 54-year period, a simple stop-loss strategy outperformed bonds 70% of the time when the market was rising and limited losses by investing in bonds during downturns. This suggests that stop-loss strategies can provide higher returns and lower losses over time.
Another study focusing on the OMX Stockholm 30 Index revealed that a trailing stop-loss strategy, especially with a 15% or 20% loss limit, significantly outperformed a buy-and-hold strategy over an 11-year period, including then the internet bubble burst and the financial crisis. This further underscores the effectiveness of stop-loss strategies in providing higher returns and reducing losses over time, across different markets and economic conditions.
3. What’s the difference between a trailing and traditional stop-loss strategy?
A trailing stop-loss strategy adjusts the stop-loss level as the price of an asset increases, locking in profits.
A traditional stop-loss strategy sets the stop-loss level based on the purchase price. Research suggests that trailing stop-loss strategies often yield better returns than traditional ones, especially at certain loss levels.
4. What stop-loss percentage should I use?
According to research, the most effective stop-loss levels for maximising returns while limiting losses are between 15% and 20%. These levels strike a balance between allowing some market fluctuation and protecting against significant downturns.
5. Can stop-loss strategies prevent large portfolio losses during market crashes?
Yes, employing stop-loss strategies or stop loss orders, especially with momentum investing, can significantly reduce the impact of market crashes. Studies have shown that well-implemented stop-loss orders can even turn potentially massive losses into minor gains by avoiding the worst periods of market downturns.
Advanced Investors FAQs
1. How do stop-loss strategies affect the Sharpe ratio and overall portfolio volatility?
Implementing a stop-loss strategy can improve the Sharpe ratio—a measure of risk-adjusted return—by lowering portfolio volatility and enhancing returns. For example, a study found that a stop-loss orders increased the average return from 1.01% to 1.73% per month and reduced the standard deviation of returns, leading to a more favourable Sharpe ratio.
2. What are the implications of using a stop-loss strategy on momentum investment strategies?
For momentum strategies, a stop-loss strategy can drastically reduce losses and increase returns by selling assets that hit a predetermined loss level and reinvesting in safer assets. This approach helps to tame momentum crashes, allowing for higher and more stable returns over time.
3. How should dividends be accounted for in a trailing stop-loss strategy?
When implementing a trailing stop-loss, it’s important to adjust for dividends. Since a stock's price drops by the amount of the dividend on its ex-dividend date, you should add the dividend to the current stock price when calculating whether the stop-loss price has been breached. This ensures that normal dividend payments do not inadvertently trigger the stop-loss orders.
4. Is there a preferred frequency for evaluating stop-loss triggers?
It's advisable to check for stop-loss triggers monthly rather than daily. This approach reduces transaction costs and avoids the over-trading that can erode returns. Monthly evaluations strike a balance between reacting to market movements and maintaining strategic discipline. Weekly may be more appropriate for pure momentum strategies.
5. Can stop-loss strategies be integrated with value investing principles?
Yes, while stop-loss strategies are typically associated with momentum strategies, they can also be adapted for value investing. For instance, a fundamental stop-loss could be used, where selling triggers are based on deteriorating business fundamentals rather than stock price movements alone. This can help value investors limit losses when a company's underlying business starts to decline.
Further Stop Loss Reading:
How to lower your losses and increase returns
How to implement the trailing stop loss rule - Stop loss order levels
Navigating Market Storms: Taming Investment Volatility
How to add a Trailing Stop loss to any stock - Get email alert
These ideas on how to sell increase profits and lower losses
