

Do you think the liquidity of a company’s shares can impact your investment returns?
I did not, but that changed when I read an interesting research paper called Liquidity Styles and Strategies in U.S., International and Global Markets written by Professor Roger Ibbotson and Wendy Hu.
What it found
The paper found that liquidity (defined as the number of yearly shares traded divided by the company’s total outstanding shares) is a strong predictor of future returns in the USA and international markets.
Low liquidity outperforms the market
The paper tested an investment strategy only using liquidity and found that it outperformed the market with lower risk as well as good down-side protection in all markets world-wide.
We also tested it
Even though we are sure the researchers did good work when they tested the investment strategy we wanted to make sure that we could repeat the results before incorporating liquidity as a ratio in the screener.
Results confirmed - outperformance
We found the same as Prof Ibbotson.
If you use a simple strategy of buying only the most illiquid companies (not undervalued or any other criteria) you would have done very well, substantially outperforming the market.
How the strategy performed
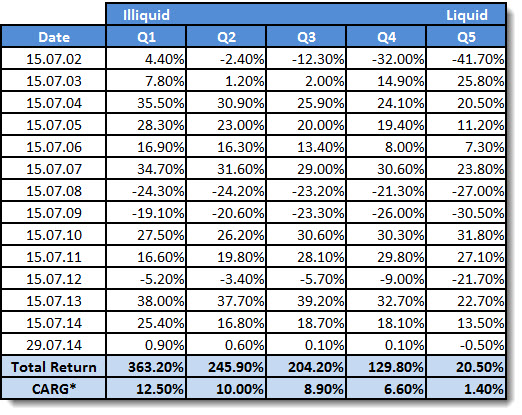
The following table shows the results of the back test of the European, Scandinavian, UK and North American markets over a period of 13 years from July 2001 to July 2014:
CAGR = Compound annual growth rate
Click here to start finding Low Liquidity investment ideas NOW!
Defined it slightly different
In the back test we defined liquidity as adjusted profits to yearly trading value and not as the number of yearly shares traded divided by the company’s total shares outstanding.
We tested both ratios and found that adjusted profits to yearly trading value gave much better returns (this is also a ratio Professor Ibbotson hinted at in other papers and interviews).
Q1 = illiquid and Q5 = liquid
In the above table Q1 (Quintile 1) represented the 20% most illiquid companies as measured by profits to total yearly traded value.
177% better than the market
Over the same 13 year period we tested the market returned 8.1% per year or 176.6%.
So, as you can see, the companies with the lowest liquidity (Q1) beat the market by 4.4% per year or 186.6% over the 13 year period, substantial out-performance I am sure you will agree.
Liquidity worth looking at
The back test shows you that liquidity is a great ratio to add to your screens to get market beating results.
Added to the screener
This is also the reason why (shortly after finishing our own back test) we added liquidity as one of the ratios in the Quant Investing stock screener.
We also included it in our best investment strategy
We also included Liquidity (Q.i) our preferred investment strategy called Qi Value - which I use in my own portfolio.
You can read all about Qi Value here:
This investment strategy is working even better than we expected +711%
How can you find low liquidity companies
After we successfully tested the ratio we searched high and low for a screener or service that offered it - we could not find any.
We even thought of the idea of only looking at companies with a market value below $100m BUT that would exclude a lot of great family controlled companies.
In the end we decided to build it into the screener we developed because nothing on the market included all the ratios and indicators we needed to implement and test our investment strategies.
Liquidity definition
In the screener we called the ratio Liquidity (Q.i) and it is calculated as follows:
Liquidity (Q.i) = Adjusted Profits / Yearly trading value
It thus shows you how high a company’s yearly adjusted profits are compared to its yearly traded value.
Yearly traded value is calculated as (Daily total shares traded x Closing price) added together for the past year.
High value means low traded value
A high Liquidity (Q.i) value thus means low yearly trading value, and a larger chance of the company’s shares outperforming the market.
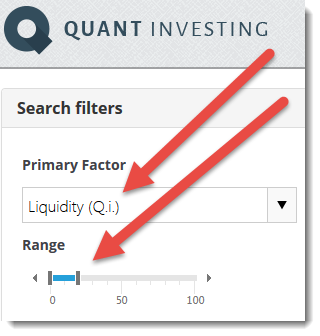
How to find low liquidity companies
To find these companies set the slider to 0% to 20%.
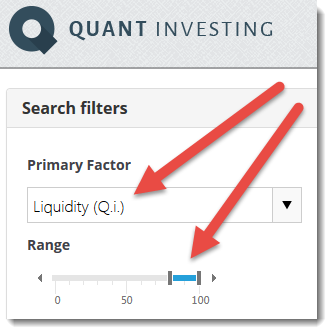
How to find high liquidity companies
A low value means high traded value which means more analysts may follow the company giving you a lower chance that the company is mis-priced.
To find these companies set the slider 80% to 100%.
Large shareholders low analyst interest
Selecting low liquidity companies can help you to identify companies with large controlling shareholders or a stable base of shareholders where traded value is low and thus less analyst interest because they cannot make money by recommending and trading of the company’s shares.
Shareholders with a long term focus
These long term stable shareholders will also most likely allow management to focus on the long-term health and profitability of the company and not just meeting the next quarterly profit forecast.
PS To get this low liquidity ratio working in your portfolio right now sign up here
PPS It's so easy to get distracted, why not sign up right now
Click here to start finding Low Liquidity investment ideas NOW!
