

Parabolic Stop and Reverse (Parabolic SAR or PSAR) is a great indicator to help you get better entry or exit (buy or sell) prices.
What is a Parabolic Stop and Reverse indicator?
The Parabolic Stop and Reverse (Parabolic SAR or PSAR) is a technical trend indicator that helps you identify reversals in stock price direction.
It is a lagging trend-following indicator that can help you set a trailing stop loss or show you buy or sell points.
It is based on the idea that prices tend to stay within a parabolic curve during a strong trend and unless a stock continues to generate more profits over time, it should be sold.
It works best with stocks or in markets with a strong trend and may generate a lot of buy and sell signals (whipsaws) if a price moves sideways or trades in a range.
How is it calculated?
The Parabolic SAR is calculated independently for each price trend.
It uses the highest and lowest price as well as the price acceleration factor (AF) to calculate where on a chart the PSAR indicator dot will be displayed.
At each step in a trend, it is calculated one period in advance. That means tomorrow's value is calculated using today’s data.
The formula for the Parabolic SAR is as follows:
Uptrend
When the price is in an uptrend, the Parabolic SAR starts below the price and moves up towards the price.
Uptrend Parabolic SAR = Prior SAR + Prior AF (Prior EP – Prior SAR)
Downtrend
When a price is on a downtrend, the Parabolic SAR starts above the price and moves down.
It is calculated as follows:
Downtrend Parabolic SAR = Prior SAR – Prior AF (Prior SAR – Prior EP)
Where:
EP is the extreme point of a trend (highest price in an uptrend or lowest during a downtrend). Each time if a new maximum (or minimum) is recorded, the EP is updated with that value.
AF is the acceleration factor. It is initially set at 0.02 and increased by 0.02 each time the EP is reached. It has a maximum value of 0.20.
Click here to start using the Parabolic SAR indicator in your portfolio NOW!
How it is displayed
It is shown on a chart as a series of dots along with the current stock price. You can also select it in the screener.
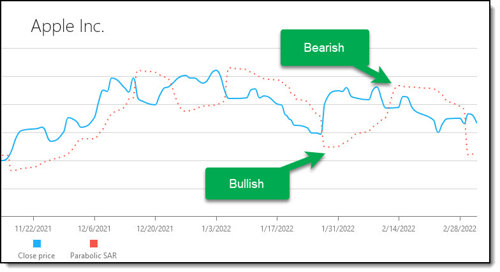
Below is bullish
If it appears below the current price, the Parabolic SAR is interpreted as a positive (upward trend) and is a buy or bullish signal.
Above is bearish
When it is appears above the current price, it is deemed a negative (downward trend) and a sell or bearish signal.
A change in the direction of the dots produces buy or sell signals that can produce a profit when the price makes big swings.
Important! The indicator is not reliable if the price movement is flat or if it trades in a range – moves between an upper and lower limit.
Setting stop losses and or buy prices
The dot above or below the current price signals can be used to set stop losses or buy signals. For example:
To set a stop loss level
If the stock price is moving up and the PSAR is below it (positive trend) you can set your stop loss at the PSAR value. This means if the price falls below the PSAR value you sell.
To set a buy price
You can use the PSAR to better time the price you buy at, and this even if you are a long-term investor.
If the PSAR value is above the stock price, the price trend is negative.
You can better time your buy decision by waiting for the price to break up through the PSAR value. This means the down trend has been broken. This gives you a lower buy price and positive trend you are investing into.
The PSAR in the stock screener
To find out exactly how to use it in the screener click here:
Parabolic Stop and Reverse (Parabolic SAR) indicator added to the Quant Investing stock screener
How to use the ratio
Available as a screening ratio: No (Use the column)
Available as an output column ratio: Yes (under the Technical heading)
How to select the bullish PSAR companies
To find companies with a bullish PSAR value, add PSAR/Close as an output column, click the Funnel icon, and add "< 1" to filter the values in the column.
Click here to start using the Parabolic SAR indicator in your portfolio NOW!