

You know value (EBIT to EV in this case) has had a tough time outperforming the market or even keeping up with the market recently.
In this back test we wanted to find out how your portfolio would have performed if you used Earnings Before Interest and Taxes (EBIT) to Enterprise Value (EV) to find undervalued companies over the past six years from 2016 to 2021.
What investment strategy was tested?
In this back test over the six-year period from 2016 to October 2021 we tested, the best single value investing ratio we have found, EBIT to EV .
Here you can look at the previous EBIT to Enterprise Value back test we did in Europe over the 12 year period June 1999 to June 2011 .
How were the ratios calculated?
To make sure we are on the same page, the ratios was calculated as follows:
EBIT to EV = Operating Income or earnings before interest and taxes (EBIT) / Enterprise Value
Enterprise Value (EV) = The current market value of the company (market capitalisation) + Long-Term Debt + Minority Interest + Preferred capital - Excess Cash.
We need to say a bit more about Excess Cash. It is the amount of cash in excess of what the company needs to run its business, in other words cash that can be paid out to investors without harming the business.
Excess cash is calculated as follows:
If Total Current Assets are greater than (2 x Total Current Liabilities), then Excess Cash is the lower of:
Cash and Short-Term Investments or
Total Current Assets - (2 * Total Current Liabilities).
If Current Assets are not greater than (2 x Total Current Liabilities) then Excess cash is 0.
Excess cash example . Let us assume a company’s Current Assets minus two times its Current Liabilities is €1000, and its Cash and Short-Term investments is €500.
You can see it has excess cash because Current assets are greater than two times current liabilities.
Excess cash is thus €500, the lower of €1000 and €500.
Click here to implement your own EBIT to EV investment strategy NOW!
Exactly what strategy did we back test
This is what the back test screen looked like:
- All companies worldwide included
- All industry sectors included
- Minimum daily trading value of > $125,000
- Minimum market value > $100 million
- Sort the result by EBIT to EV from high to low
- Buy the top 10% of companies
How and when were portfolios formed?
Portfolios were formed on the last trading day of the year and sold again on the last trading day of the following year. In 2021 the last portfolio was sold on 14 October 2021.
Portfolios were formed by taking the 10% of companies with the highest EBIT to EV ratio on each rebalancing date.
This resulted in an average of 850 companies in the portfolio each year.
If you are thinking, “This is too many companies!” you would be right. But remember we are trying to test to see if EBIT to EV is a good investment strategy. To do this more companies are better because no one company can have a big impact on the yearly returns.
Costs, fees, and taxes not included
We did not include any trading fees, taxes in the back test.
What was not included
Dividends were not included in the return calculation. So, your actual returns would have been higher.
Currency movements were also not included. We simply averaged the price returns of all the companies on each rebalancing date to get the average return of the portfolio.
Who and why was this back test done?
We did the back test using our own point in time database. You can read more about the database and how you can use it to back test your investment ideas here:
We back tested the strategy to see how a great investment strategy performed the past few years.
No, we do not have a conflict of interest we just want to help our own returns and help you improve your returns .
How we address biases in the back test
Look-ahead bias
Look-ahead bias happens when the data the back test is based on could not have been known or available during the back test period.
For example, if you formed portfolios on 31 December each year using the company’s 31 December financial information. This is not possible because the company’s 31 December financial information is only released three to five months after 31 December.
As the point-in-time back test database is formed by saving all the data in the screener every day, look ahead bias is excluded. This is because the data on the days the portfolios were formed uses the exact data in the screener as it was on that day in the past.
No adjustments are made to the saved data after it has been saved.
Survivorship bias
Survivorship bias can lead to better back test returns because companies that went bankrupt were ignored (not in the back test universe) when the back test portfolios were formed.
This bias is excluded as all the companies in the screener is saved each day which is used to build the back test database.
Should a company have gone bankrupt or be delisted the database saved the last price the company’s stock traded at. So, all companies are included in the database, not only companies that survived.
Over-fitting bias
Overfitting bias can take place if the back test is done using ONLY a period when the investment strategy worked very well. This means if you tested the strategy in another period, it would not work as well at all.
We did not select a specific period to test the strategy we used ALL the historical data we had.
Also, as a value-based investment strategy lagged the market over the past 10 or more years, we knew that the EBIT to EV investment strategy, would have underperformed the market.
Click here to implement your own EBIT to EV investment strategy NOW!
So, does the strategy work?
Now for the most important part did the strategy work.
No, as you can see below, it did not beat the market.
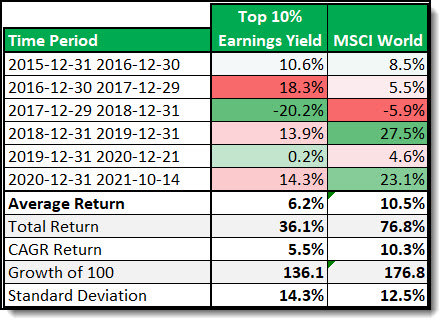
Source: Historical screener at www.quant-investing.com
As you can see it performed a LOT worse than the market and it did so with more volatility – higher standard deviation.
This just further shows the very tough times value investors have gone through the past six years. This has been going on for longer, but we could not show you as our data only goes back to the start of December 2015.
Summary and conclusion
So, is value investing dead? Should I leave value investing for dead and invest everything in:
- Technology companies with a price to earnings ratio of over 35,
- Crypto currencies and
- New listings with eye watering values making losses?
You can of course do that, but we would not recommend it.
We both know how that all ended with the bursting of the internet bubble. If you cannot remember that, or it was before you got into investing read this great article on the dotcom bubble bursting .
The thing with bubbles like this is they go on until they cannot go on any more. And no one can say when they will burst. If someone says they can, they are lying.
I do not know about you, but I do not want to be invested in overvalued junk even if it does go on for a while or a lot longer. And I definitely do NOT want to be holding assets like that when the bubble does burst.
What can I buy now?
In spite of the overvalued market, I am still finding a LOT of companies that are profitable, with little or no debt, with solid free cash flow generation and some of them still pays an attractive dividend. Companies like the ones I recommend in the Quant Value investment newsletter .
How you can implement an EBIT to EV investment strategy
This article shows you exactly how to implement an EBIT to EV investment strategy in your portfolio: How and why to implement an EBIT to enterprise value investment strategy.
PS To get an EBIT to Enterprise Value investment strategy working in your portfolio today simply sign up right here .
PPS It is so easy to put things off, why not sign up right now.
Click here to implement your own EBIT to EV investment strategy NOW!
