

Do you think adding a company quality ratio to your investment strategy can increase your returns?
We were skeptical as our experience testing quality ratios in the research paper Quantitative Value Investing in Europe: What Works for Achieving Alpha was mixed.
ROA and ROIC doesn’t work
We found that Return On Invested Capital (ROIC) and Return On Assets (ROA) weren’t good predictors of returns. Even though high quality companies did do better than low quality companies (low ROIC and ROA) returns did not increase in a linear way as you moved from low quality to high quality companies.
And if you only invested in high quality companies it would not have helped you to consistently beat the market.
This quality ratio works
Our thinking on quality ratios changed when we read a very interesting research paper called The Other Side of Value: The Gross Profitability Premium by Professor Robert Novy-Marx. In the paper he found a quality ratio that worked as well as a valuation ratio.
How calculated
Professor Novy-Marx defined a quality company as one that had a high gross income ratio or Gross Profitability (in the Quant Investing stock screener the ratio is called Quality Novy-Marx) which he calculated by dividing gross profits by total assets.
He defined gross profit as sales minus cost of sales and assets simply total assets as shown in the company’s balance sheet (current assets + fixed assets).
Does it work?
In the paper Professor Novy-Marx proved that this simple ratio has about the same predictive return value as the price to book ratio in spite of companies with a high gross income ratio (Quality Novy-Marx) being a lot different if you compare them to undervalued companies with a low price to book ratio.
Companies with high Gross Profitability (Quality Novy-Marx) ratio generated significantly higher average returns than less profitable companies in spite of them, on average, having a higher price to book ratio (more expensive) and higher market values.
Because value (low price to book) and profitability (high Quality Novy-Marx ratio) strategies’ returns are negatively correlated (the one goes up when the other goes down) the two strategies work very well together.
So much so that Professor Novy-Marx in the paper suggests that value investors can capture the full high quality outperformance without taking on any additional risk by adding a high quality strategy to an existing value strategy.
If you do this, he found that this reduces overall portfolio volatility, in spite of it doubling your exposure to the stock market.
To get this Quality Ratio working in your portfolio Click here
Gross Profitability stays high
Credit Suisse in their great 26 September 2016 research paper called The Base Rate Book - Integrating the Past to Better Anticipate the Future showed that an added benefit of you using Gross Profitability is that the ratio stays high in the short as well a long term.
This means that you can assume that the existing Gross Profitability margin gives you a good estimate of what it will be in future.
The following chart shows you just how stable Gross Profitability is. For companies with a high value, it stays high and low for low Gross Profitability companies.
Gross Profitability Regression Toward the Mean
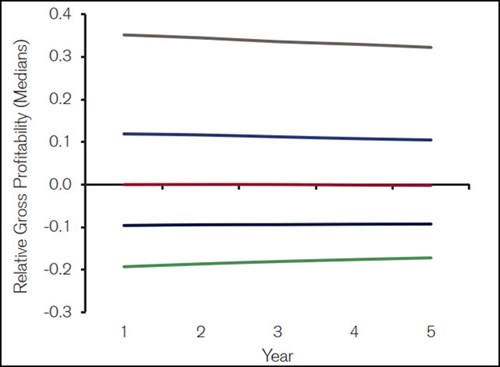
Source: Credit Suisse - The Base Rate Book, 26 September 2016
High Gross Profitability leads to great returns
The following chart shows you that high Gross Profitability leads to high returns.
Total return for the highest and lowest quintiles (20%) of
Gross Profitability companies over the 26 years (1990-January 2016)
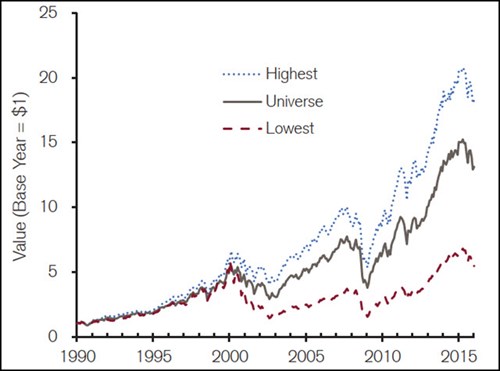
Source: Credit Suisse - The Base Rate Book, 26 September 2016
We also back tested it
We of course also wanted to test if the Quality Novy-Marx ratio works on the European stock markets.
Our back test (on European companies) over just less than 12 years from July 2001 to March 2013 came up with the following result:
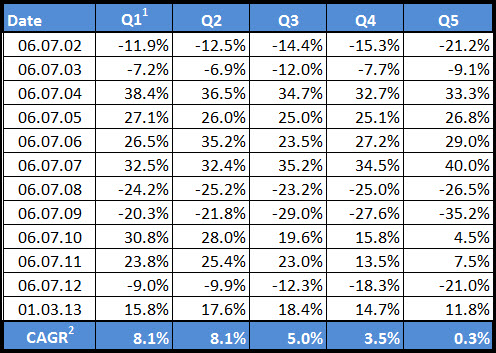
Source: Quant-Investing.com High quality companies = Q1 Low quality companies = Q5
1 Quintiles
2 Compound Annual Growth Rate (CAGR)
As you can see the results are (apart from Q1 to Q2) linear which means as you move from low quality companies (Q5) to high quality companies (Q1) returns increase every time.
Also, high quality companies (Q1) performed substantially better than low quality companies (Q5).
This clearly shows that the Quality Novy-Marx ratio is a very good ratio to add to your investment strategy.
High quality substantially outperformed the market
High quality companies also substantially outperformed the market.
The STOXX Europe 600 index over the same period had a compound annual growth rate of -0.82%, worse than even the worse quintile, most likely because of the banks being included in the index (not in the back test universe because you cannot calculate the Quality Novy-Marx ratio for them).
To get this Quality Ratio working in your portfolio Click here
In summary - High Gross Profitability Marx works
From these two back tests you can see that adding quality companies, defined as companies with high gross profits to total assets, can definitely add to your investment returns.
We have not tested it, but Professor Novy-Marx mentions that if you are a value investor quality companies have the ability to increase your returns and decreased the volatility of your portfolio.
If you add this quality ratio to your screens you will find companies that are not very undervalued which is something that value investors will have to get used to.
How to add Gross Profitability to your investment strategy
In the Quant Investing stock screener you can easily add the Gross Profitability ratio (called Gross Margin (Marx)) to your investment strategy. Just use one of the four sliders as shown below.
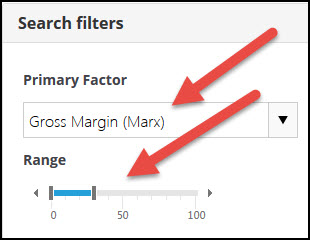
To find companies with a high Gross Margin Marx set the slider from 0% to 30% (the best 30% of companies) as in the above screenshot.
Or you can select the Gross Margin (Marx) as a column in your screen which will allow you to filter and sort the Gross Margin (Marx) values.
PS To get this quality ratio working in your portfolio right now sign up here.
PPS It costs less than a cheap lunch for two and if you do not like it you get all your money back - if that does that not sound fair I do not know what does.
To get this Quality Ratio working in your portfolio Click here
