

This article shows you the summarised results of all the back tests of the Piotroski F-Score investment strategy we could find.
What the Piotroski F-Score does
The Piotroski F-Score was developed by Professor Joseph D. Piotroski in his search for a ranking system that can increase the returns of a low price to book investment strategy.
I am not going to show you how the Piotroski F-Score is calculated you can read all about that over here: This academic can help you make better investment decisions – Piotroski F-Score
Does it work - F-Score back test?
When Prof Piotroski tested the F-Score over the 20 year period from 1976 to 1996 it exceeded his most optimistic expectations.
By buying only companies that scored the best (8 or 9) on his nine-point scale, or F-Score as he called it, over the 20 year period from 1976 to 1996 led to an average yearly outperformance over the market of 13.4%.
Even more impressive were the results of a strategy of investing in the highest F-Score companies (8 or 9) and shorting companies with the lowest F-Score (0 or 1).
Over the same period from 1976 to 1996 (20 years) this strategy led to an average yearly return of 23.0% better than the market.
Summary of the back test
Here are two tables from Professor Piotroski’s research paper: Value Investing: The Use of Historical Financial Statement Information to Separate Winners
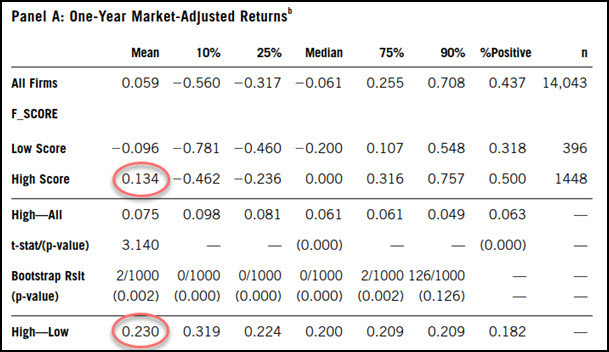
Source: Value Investing: The Use of Historical Financial Statement Information to Separate Winners from Losers p16
High Score = Low price to book companies with a Piotroski F-Score of 8 or 9
Low Score = Low price to book companies with a Piotroski F-Score of 0 or 1
High-Low = Long investment in High Score companies and short Low Score companies
Worked best on small companies
These were the back tested returns when he split the results between small, medium and large companies.
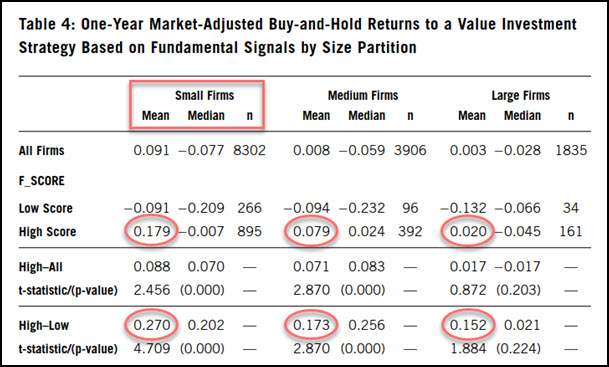
Source: Value Investing: The Use of Historical Financial Statement Information to Separate Winners from Losers p19
As you can see small companies would have given you the best returns. But, because of their size they would most likely not work for a long short strategy.
Important! - Companies to avoid like the plague
Avoiding low F-Score companies is a great idea as you can see for all three groups of companies these companies substantially underperformed the market of between -9.1% to -13.2% per year for 20 years!
So whatever you do don't buy companies with a Piotroski F-Score of 0 or 1.
Click here to get the Piotroski F-Score working in your portfolio
Can the Piotroski F-Score to improve the return of Growth stocks?
If you are a growth investor can you use the Piotroski F-Score to increase your returns?
That is what a friend of mine set out to test in an interesting research paper called: Utility of Piotroski F-Score for Predicting Growth Stock Returns.
In the paper he looked at the following:
- Can the Piotroski F-Score increase the returns of a growth investment strategy?
- What are the structural differences between growth and value investing?
- How large is the improvement in returns the use of the Piotroski F-Score can give growth investors.
- The success of a long-short strategy that buys high F-Score and shorts low F-Score growth companies?
- Practical ideas of how you can get the return benefit between high and low Piotroski F-Score growth companies.
Astounding results
The table below shows the results of the study:
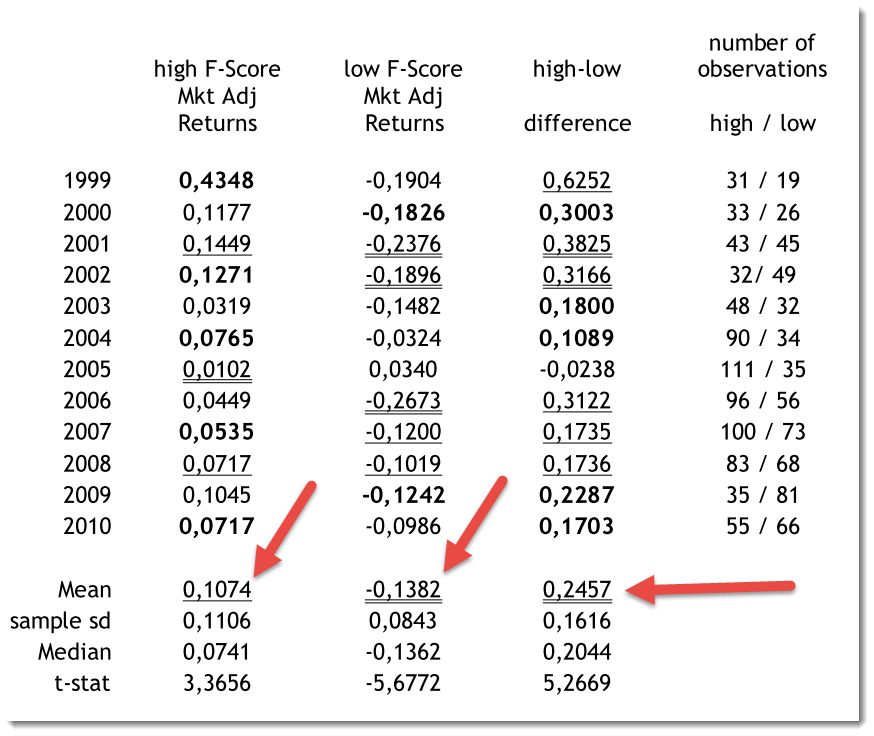
24.57% better than the market
As you can see there is a huge benefit to growth investors of using the Piotroski F-Score.
Over the 12 year period High Piotroski F-Score companies (high quality companies) generated an average yearly return of 10.74% better than the market whereas low Piotroski F-Score companies (low quality companies) generated a return of -13.82% worse than the market.
The difference in the average return, or the return of a long short strategy (high-low) was an astounding 24.57% better than the market.
Click here to get the Piotroski F-Score working in your portfolio
The Piotroski F-Score improved the return of all 13 investment strategies
In the research paper Quantitative Value Investing in Europe: What Works for Achieving Alpha we tested 168 different investment strategies, on companies in the Eurozone, to find what strategies would have given you the best investment return over the 12-year period from 13 June 1999 to 13 June 2011.
In spite of the test period being quite short it was not a good time to be invested in the stock market, as it included the internet stock market bubble (1999), two recessions (2001, 2008-2009) and two bear markets (2001-2003, 2007-2009).
One remarkable finding
In spite of the Piotroski F-Score being a quality indicator (it can’t tell you if a company is undervalued) if you used it as a single factor to select investment ideas you would have done surprisingly well as the Piotroski F-Score was the fifth best single factor strategy we tested.
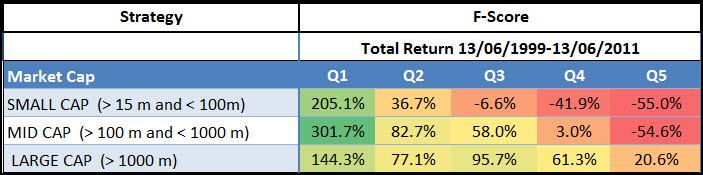
The following table shows you what your returns you could have earned if you used only the Piotroski F-Score to get investment ideas.
Click image to enlarge
Source: Quantitative Value Investing in Europe: What Works for Achieving Alpha
Q1 was companies with the best (high) Piotroski F-Score and Q5 companies with the worst (lowest) F-Score.
Market returned only 30.5%
For all company sizes the companies with the best F-Score substantially beat the market which over the 12-year period of the study returned 30.54 % or 2.25% pa, dividends included.
Piotroski F-Score with other ratios improved returns over 200%
We also tested the Piotroski F-Score with 13 other strategies to see if it could increase your returns.
In this back test we first selected companies with a Piotroski F-Score of 8 or 9 then selected one of the 13 strategies.
What we found was remarkable
With the exception of two other ratios (ROIC and Net Debt on Market Value), combining the F-Score with another ratio would have given you a lot higher returns.
The following table shows you how much the return of the stand-alone strategies were improved by selecting only companies with a good Piotroski F-Score.
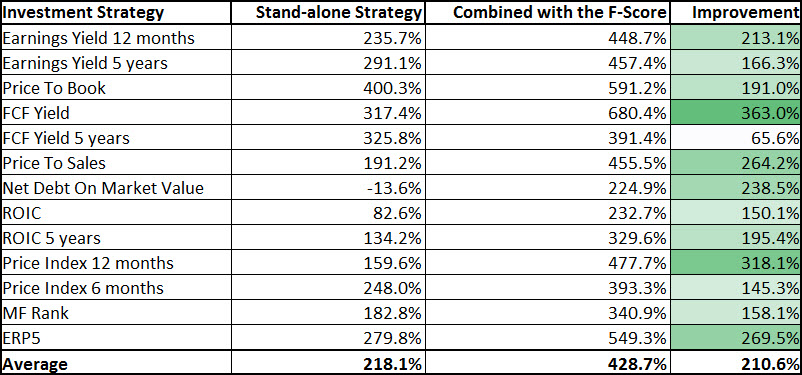
Click image to enlarge
Source: Quantitative Value Investing in Europe: What Works for Achieving Alpha
Best single ratio strategy = Price to book +400.3%
As you can see in the Stand-alone strategy column price to book was the best stand-alone strategy you could have used over the period.
This may have been because the test period contained two market crashes (internet bubble and the 2008 financial crisis) after which a low price to book strategy usually does very well.
However, be careful of a low price to book investment strategy because it has long periods of market underperformance. You can read more about it here: Be careful of this time tested value ratio
Best strategy with Piotroski F-Score = Free cash flow yield (FCF Yield) +680.4%
The strategy combined with the best Piotroski F-Score companies that gave the best returns over the 12 year period was FCF Yield which returned just over 680%.
Not bad at all I am sure you will agree.
Most improved strategy = Free Cash Flow Yield +363%
The Piotroski F-Score was able to add 363% to the return of a strategy of buying only the companies with the highest FCF Yield.
The second most improved strategy was Price Index 12 months (EBIT/Enterprise Value) which the Piotroski F-Score improved 318.1% from 159.6% to 477.7%.
As you can see all the returns were a lot better as on average the returns of all 13 ratios or strategies increased 210.6% over 12 years, that’s a huge improvement.
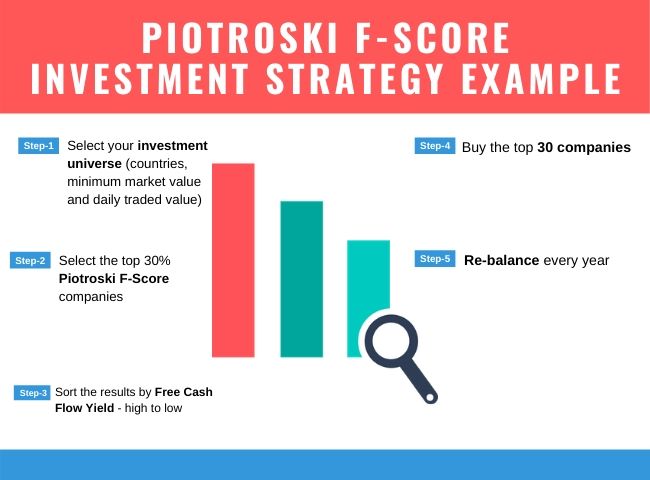
Piotroski F-Score, Free Cash Flow Yield investment strategy
Here is a Piotroski F-Score, Free Cash Flow Yield investment strategy example:
Click here to get the Piotroski F-Score working in your portfolio
Adding quality can substantially increase your returns
Thus adding a quality indicator, which the Piotroski F-Score really is, to your investment strategy or screen can increase your returns substantially.
The Piotroski F-Score, if you look at the way that the nine ratios it consists of are calculated, helps you add companies with good fundamental momentum to your portfolio.
And that's where its real value lies.
Summary and conclusion
I am sure this article has convinced you that the Piotroski F-Score is a great indicator that:
- Increases your returns
- Helps you screen out deteriorating companies (bad fundamental momentum)
- Works especially well on small companies
- Increased the return of nearly all strategies we tested
- You can use as a fundamental stop loss (sell if F-Score < 6)
PS Everything you need to implement the Piotroski F-Score in your investment strategy can be found here.
PPS Why not sign up now while it is still fresh in your mind. You can cancel at any time for a FULL refund if you are not happy. Sign up here.
Click here to get the Piotroski F-Score working in your portfolio
Another interesting Piotroski F-Score articles
Here are another interesting article on the Piotroski F-Score:
This academic can help you make better investment decisions – Piotroski F-Score
Can you use the Piotroski F-Score to improve Growth Investment Returns?
Use the Piotroski F-Score to seriously improve your returns
Ever thought of using a fundamental stop-loss?
Price to Book & Piotroski F-Score investment strategy
Start using the Piotroski F-Score to increase your returns 210.6%
